What Is A Liquidation Cascade In Crypto And Why Prices Drop So Fast


What is a liquidation cascade? It is a chain reaction in leveraged markets: a price move forces some traders out of their positions, those forced exits push the price further, and that pushes the next group of traders over their own liquidation line. In this article, Backcom.io explains how the chain works step by step, why long squeeze crypto moves are so violent, what forced liquidations Bitcoin traders faced in the largest recorded event, how to read a liquidation heatmap, and how to size your own risk so a cascade does not decide your trade for you.
1. What Is A Liquidation Cascade In Crypto?
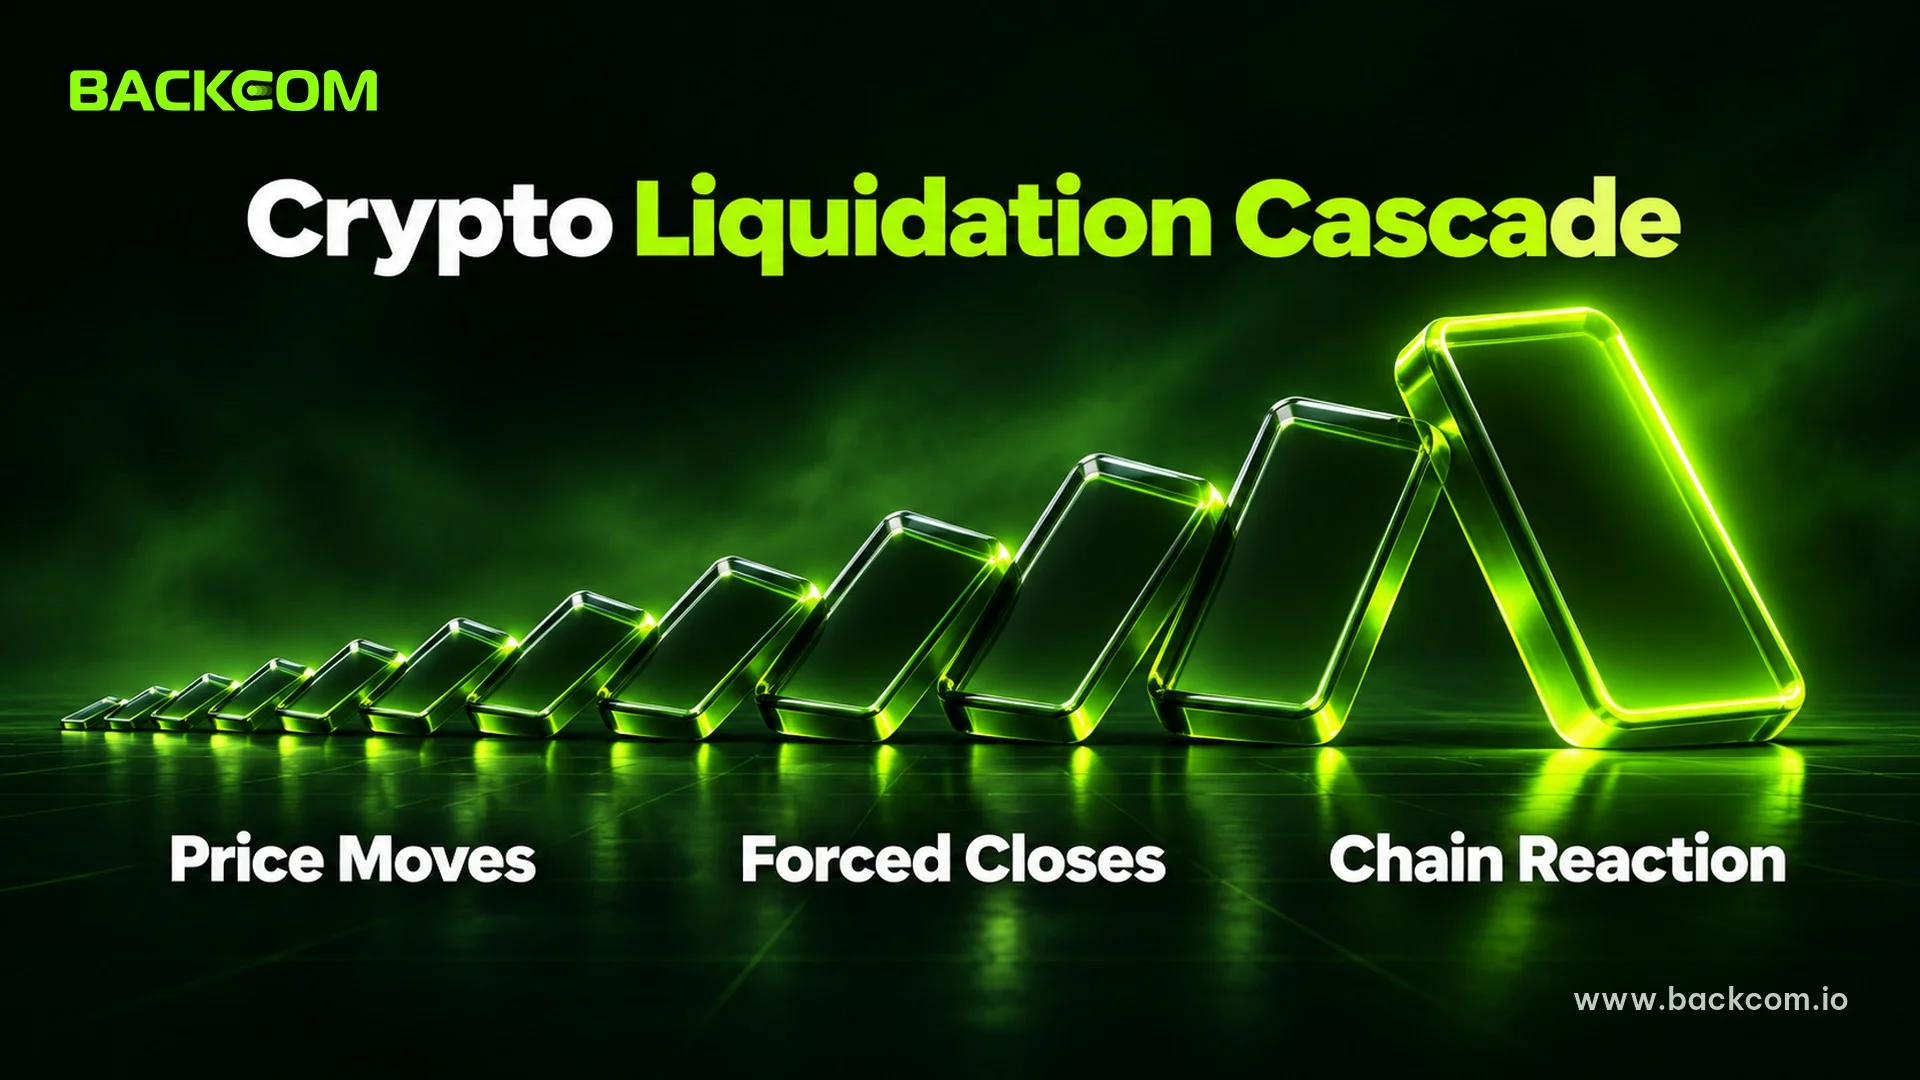
A liquidation cascade is a self-reinforcing sequence of forced position closures in which each wave of liquidations moves the price enough to trigger the next wave. It needs three ingredients: leveraged positions, a price move large enough to hit some of them, and a market too thin to absorb the forced orders without moving.
Most crypto derivatives are perpetual futures. If you are new to the market, start with our beginner guide to how crypto works, then read our guide to what perpetual futures are in crypto. With leverage, a small price move wipes out a large share of your margin. When the loss reaches the exchange's maintenance level, the platform closes the position automatically. That is a liquidation, and it is not a choice: the exchange sends a market order on your behalf, whatever the price on the book.
The word "cascade" matters because those closing orders are themselves trades. A long position is closed by selling, so a wave of liquidated longs is a wave of market sell orders. Selling pushes the price down, and a lower price brings the next set of liquidation prices into range. The loop continues until the leveraged positions near the price are gone or buyers finally step in.
Key terms you will meet in this article:
- Liquidation price: the price at which your margin no longer covers the loss and the exchange closes the position.
- Maintenance margin: the minimum equity the exchange requires to keep a position open.
- Market order: an order that executes immediately at the best available prices, even if they are poor.
- Order book depth: how much size is waiting at prices near the market.
Our article on how margin calls work in crypto covers the warning signs that come before a liquidation.
2. How Does A Crypto Liquidation Cascade Happen Step By Step?
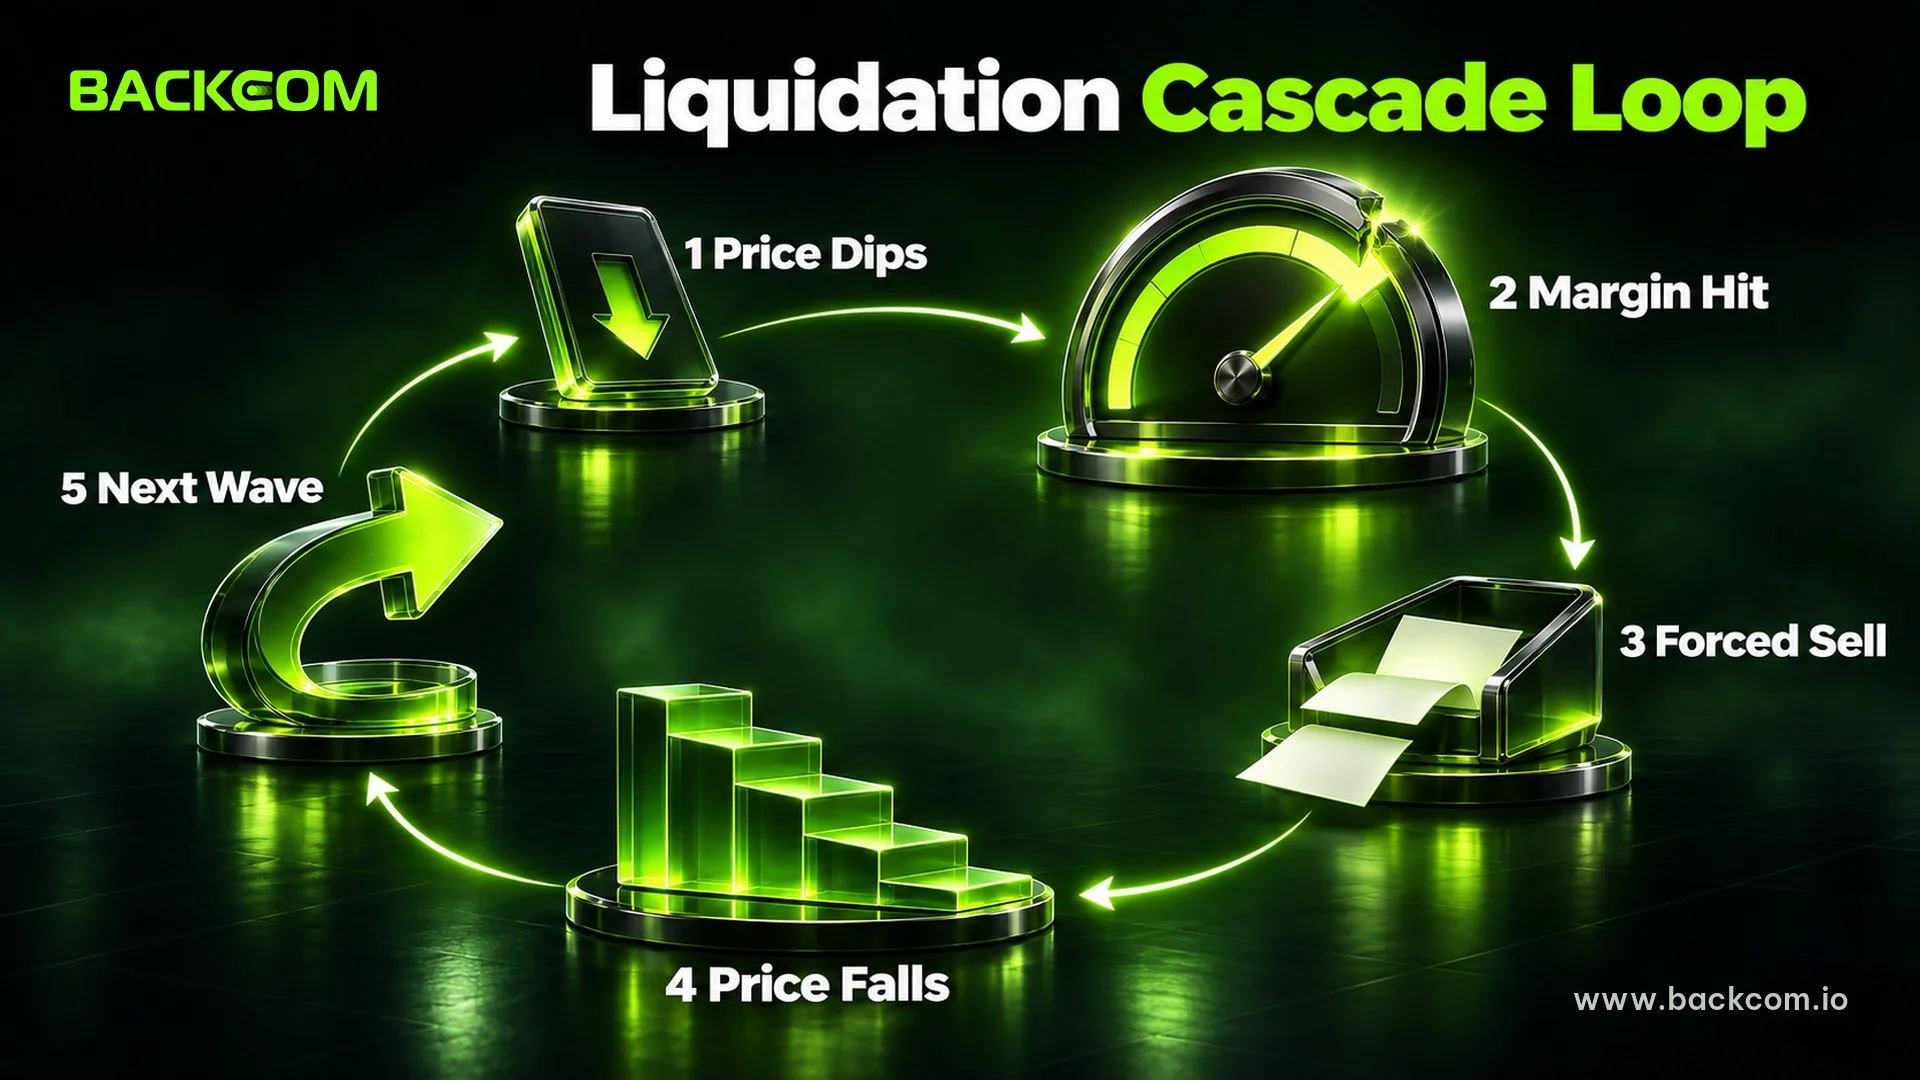
A crypto liquidation cascade usually runs through the same five stages: crowded positions, a trigger, the first forced sales, thinner liquidity, and a final burst. The sequence below is simplified, but it is the same loop that analysts describe after every large crash.
- Crowded positioning. Many traders hold the same direction with high leverage. Open interest, the total value of open contracts, climbs. Our guide to open interest in crypto futures shows how to read that build-up.
- A trigger. It can be a data release, a headline, a large market sell order, or no clear reason at all. The trigger only needs to push the price into the first cluster of liquidation levels.
- The first forced sales. The most heavily leveraged accounts are closed first, because their liquidation prices sit closest to the market.
- Liquidity thins out. Market makers widen their quotes or pull orders when prices move fast. Each forced sale now moves the price more than the one before. This is the same effect described in our explainer on slippage in crypto.
- The burst and the exhaustion. Liquidations accelerate, then run out of fuel once the nearest positions are cleared. Price often rebounds sharply because the selling was forced, not chosen.
A Simple Worked Example
The numbers below are illustrative and ignore fees and exchange-specific formulas. Assume Bitcoin trades at 100,000 USD.
- Group A holds 20x long positions. A fall of roughly 4% to 5% brings them to liquidation, around 95,500 USD.
- Group B holds 10x long positions. A fall of roughly 9% brings them to liquidation, around 91,000 USD.
- Group C holds 5x long positions. They survive until roughly 80,000 USD.
If a large sell order pushes the price to 95,500 USD, Group A is liquidated. Suppose their forced selling adds enough pressure to take the price to 91,000 USD. Now Group B is liquidated, and its forced selling reaches further down. Nobody in Group B changed their view of the market. The earlier wave simply moved the price to their liquidation line.
Higher leverage means a closer liquidation price, so the most leveraged traders are the fuel for the first stage of every cascade. To work out where your own line sits, follow our guide to calculating your liquidation price with BTC examples.
3. Why Prices Drop So Fast: Liquidity, Market Orders And Funding
Prices drop fast in a cascade because forced closures are market orders that arrive when the order book is at its thinnest. Three things combine to make the move sharper than ordinary selling.
Forced Orders Do Not Wait For A Good Price
A normal seller can place a limit order and wait. A liquidation engine cannot: it must close the position now. If the next bid is 0.5% lower, the order fills there, and the next order fills lower still. See our overview of crypto order types for the difference between limit and market execution.
Liquidity Retreats When It Is Needed Most
Market makers manage their own risk. When volatility jumps, many reduce size or step back, so depth near the price falls. Less depth means each sale moves the price further. That is why a cascade can look disproportionate to the news that started it.
Crowded Trades Leave A Visible Footprint
When most traders lean the same way, funding rates on perpetual futures tend to rise because the crowded side pays the other side. Elevated funding is not a prediction, but it is a sign that many people hold the same leveraged bet. Our guide to the funding rate and how to calculate it explains the payment mechanism.
4. Long Squeeze Crypto Moves: Why Both Longs And Shorts Get Hit
A long squeeze is a cascade in which leveraged long positions are forced to sell into a falling price. The mirror image is a short squeeze, where leveraged shorts are forced to buy into a rising price. The mechanics are identical; only the direction changes.
In a long squeeze, forced sells push the price down, which liquidates more longs. In a short squeeze, forced buys push the price up, which liquidates more shorts. In both cases, forced liquidations drive the move instead of reacting to it, and Bitcoin traders on either side can be caught.
Three points help you tell a squeeze from a normal trend:
- Speed: the move happens in minutes, often with a long wick on the chart.
- Volume and liquidations spike together: exchange data shows a burst of closed positions during the move.
- Partial retracement: after the forced selling ends, the price often recovers part of the drop, because the sellers were not making a considered decision.
A rebound does not mean a cascade was harmless. If you were liquidated on the way down, your position is closed at the worst moment and you do not take part in the recovery.
What Happens When Liquidations Cannot Cover The Loss
Sometimes the price gaps through a liquidation level so quickly that the position closes at a price worse than the bankruptcy price. The shortfall has to be covered by someone. Most platforms use an insurance fund first, which our article on the insurance fund in crypto futures describes. If the fund is not enough, some platforms use auto-deleveraging, closing profitable positions on the opposite side. Rules differ by platform, so read the contract specifications of the venue you use.
5. Forced Liquidations Bitcoin Traders Faced In The October 2025 Crash
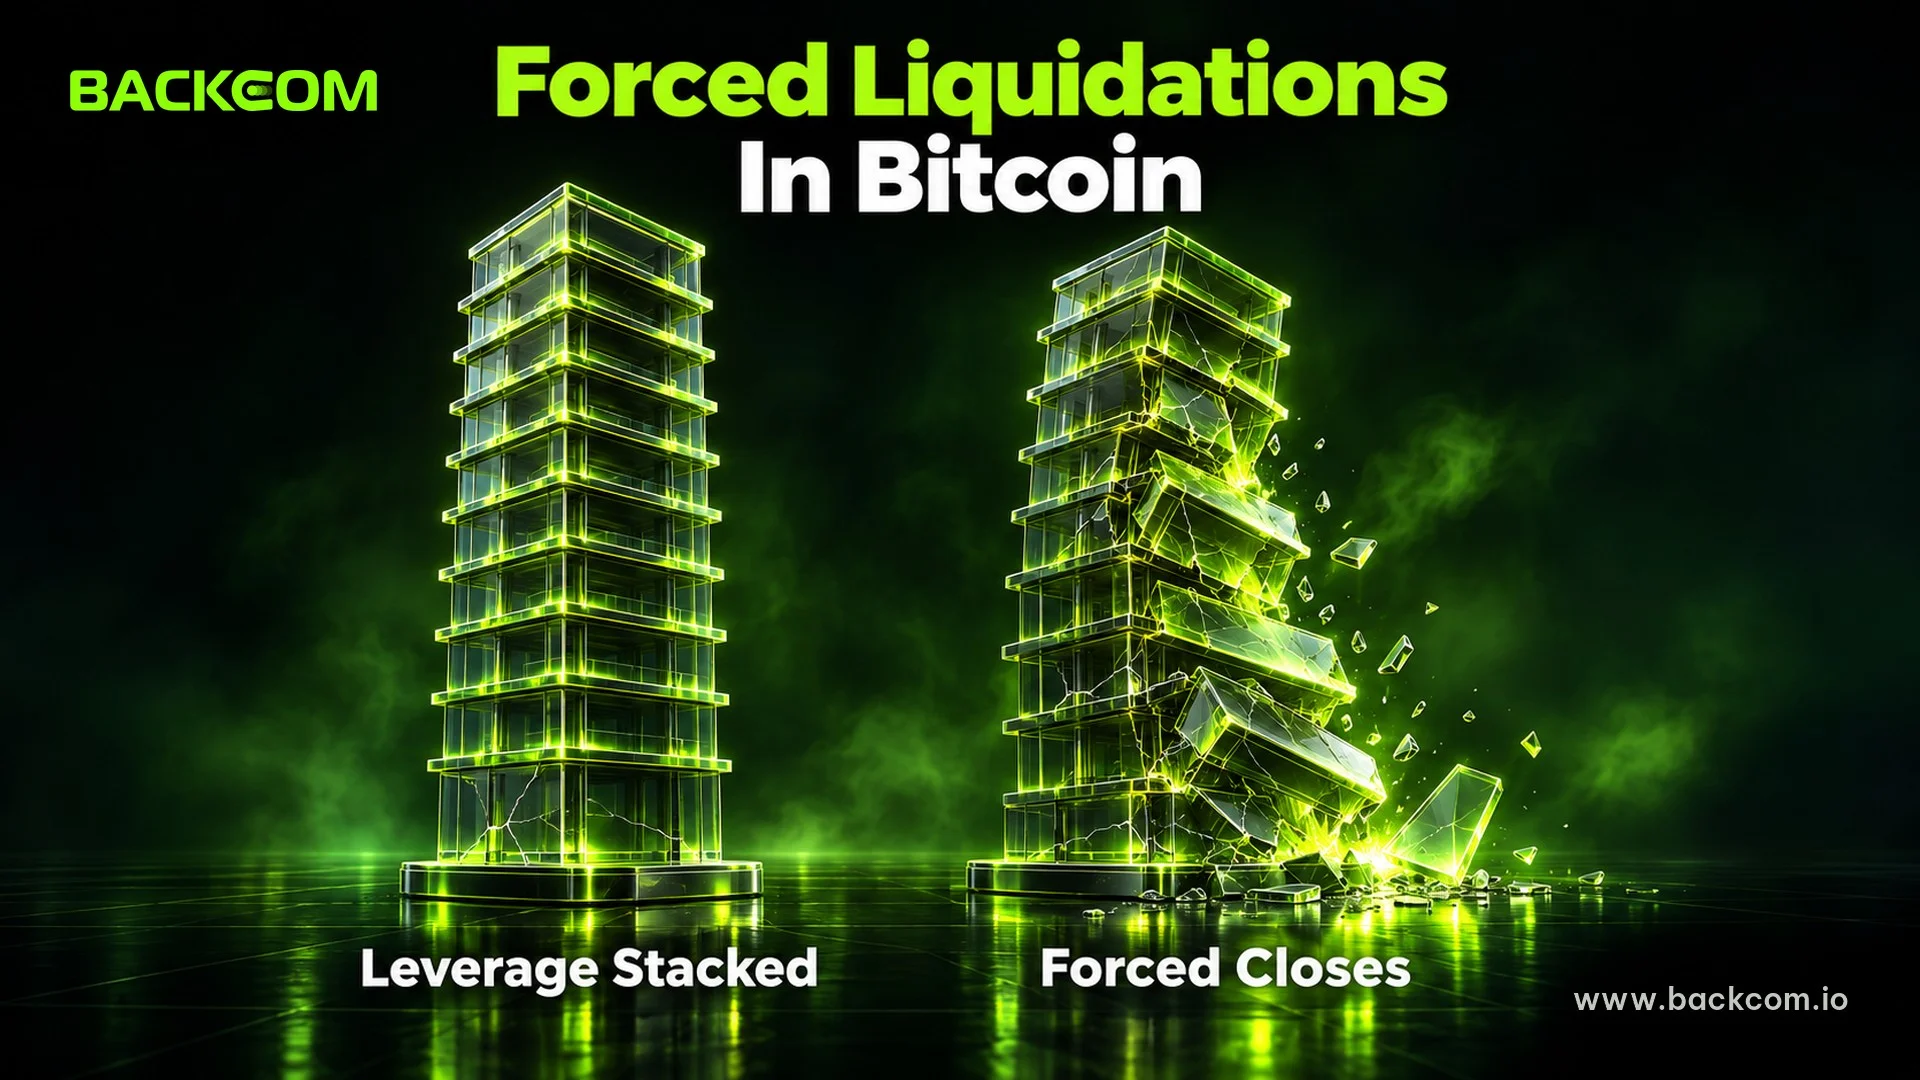
The largest liquidation event on record at the time of writing took place on 10 October 2025, when CoinGlass reported about 19.13 billion USD of liquidations over 24 hours. According to a Decrypt report on the record liquidations, the figure covered about 1.6 million traders, and Bitcoin fell from above 121,000 USD in the morning to below 106,000 USD in the afternoon, according to CoinGecko. CoinGlass itself warned that the real total was probably higher because some exchanges report only a sample of liquidation orders.
An FTI Consulting analysis of the October 2025 crash describes the ingredients that match the loop in section 2:
- open interest and funding rates were already elevated, with funding rising from about 10% to almost 30% annualized in the days before;
- top-of-book depth for BTC fell by more than 90% on key venues that day, so forced orders moved prices far;
- auto-deleveraging closed some profitable hedged positions, leaving those portfolios exposed.
Two months later, the same analysis notes, Bitcoin was about 30% below its early-October high and open interest was more than 40% below its peak. Figures from liquidation trackers are not audited, so treat them as estimates. The lesson is structural rather than about any single date: leverage, thin depth and automatic closures can turn a large move into a very large one.
6. How To Read A Liquidation Heatmap Without Misusing It

A liquidation heatmap is a chart that estimates where clusters of leveraged positions would be liquidated, drawn as bright bands at price levels above and below the market. Data providers build them by combining open interest with assumed leverage levels and entry prices. Because exchanges do not publish individual positions, every heatmap is a model, not a record.
Use it as a map of where fuel might be, not as a signal:
- Bright bands near the price suggest a nearby cluster. Prices are sometimes drawn toward them, because forced orders there can move the market.
- Large unbalanced bands on one side show where a squeeze could be larger.
- Different providers disagree. Their assumptions about leverage differ, so compare more than one source before relying on any level.
Three common mistakes:
- Treating a band as a guaranteed target. Price may never visit it.
- Trading against the move because it "must" reverse. Forced selling can run well past a level.
- Ignoring your own level. Your liquidation price is the only band that you can control.
7. How To Protect Yourself From Liquidation Cascades
You cannot predict a cascade, but you can make sure your position survives one. The steps below reduce the chance that a fast move forces you out.
- Use lower leverage. A lower multiple puts your liquidation price further from the market. Our guide to leverage in crypto trading shows the risk at each level.
- Know your margin mode. Isolated margin limits the loss to the margin assigned to one position, while cross margin shares your balance across positions. Compare them in cross margin versus isolated margin.
- Place a stop-loss before your liquidation price. A stop you control closes the trade on your terms, which usually costs less than a forced closure. See how to use a crypto stop-loss for placement.
- Size positions from the loss you accept. Our crypto position size calculator guide walks through the maths.
- Keep spare margin. Extra margin moves your liquidation price away, though it also puts more of your balance at risk.
- Avoid crowded, high-funding trades with high leverage. When funding is elevated, many traders hold the same bet.
Estimated risk per trade = position size × distance from entry to stop-loss. Keep that figure at a small share of your account, and do not move the stop further away just to avoid being stopped out.
Frequently Asked Questions (FAQ) About Liquidation Cascades In Crypto
What Is A Liquidation Cascade In Simple Terms?
It is a chain reaction. Forced closures of leveraged positions push the price, the price move triggers more forced closures, and the cycle repeats until the nearby leveraged positions are gone. It needs leverage and thin liquidity to work.
Can You Predict A Crypto Liquidation Cascade?
Not reliably. Open interest, funding rates and heatmaps show where leverage is crowded, but they do not say when or whether a trigger will arrive. Treat them as risk context, and focus on a position size that survives a sudden move.
Do Liquidation Cascades Only Hurt Long Traders?
No. A long squeeze hits longs when the price falls, and a short squeeze hits shorts when the price rises. The mechanism is the same in both directions.
Can A Liquidation Cascade Happen In Spot Trading?
Not in the same way. Spot holders are not forced to sell by a margin engine. Cascades come from leveraged derivatives and margin trading, although they can move spot prices too.
Why Does Price Often Rebound After A Cascade?
The selling was forced rather than chosen. Once the nearby leveraged positions are cleared, that pressure disappears and buyers can return. A rebound is common but not guaranteed, and it does not help a trader who has already been liquidated.
Conclusion: Respect The Chain Reaction, Not Just The Price
A liquidation cascade is what happens when leverage, forced market orders and thin liquidity meet. The price falls because positions are closed for the traders, not because every trader decided to sell. You cannot time it, but you can keep leverage modest, understand your liquidation price, and use stops that you set yourself. To go deeper, read our guide to the insurance fund and how to calculate your liquidation price.
Disclaimer: This content is compiled by Backcom.io for information only and is not investment advice. Leveraged crypto trading carries a high risk of loss, including the loss of your whole margin. Figures from third-party trackers are estimates. Rules on crypto and derivatives differ by country, so check the rules where you live before you trade.
Was this article helpful?
Join The Backcom.io Community
Get the latest on trading rebates, trading tips, and broker deals — and connect with thousands of traders worldwide.

Backcom App
Track Your Rebates Every Day
Every rebate is visible by broker and by day. Manage your wallet and withdrawals in one place.
Open Backcom App