What Is Open Interest In Crypto Futures And How To Read It


What is open interest? Open interest is the total number of derivative contracts, such as futures, that are still open and have not been closed or settled. It tells you how many positions are currently open in a market, not how much was traded. In this article, Backcom.io explains the open interest meaning, how open interest vs volume differs, how to read rising open interest and price together, and how open interest and funding rate combine into a crowding signal.
What Is Open Interest? A Plain-English Definition
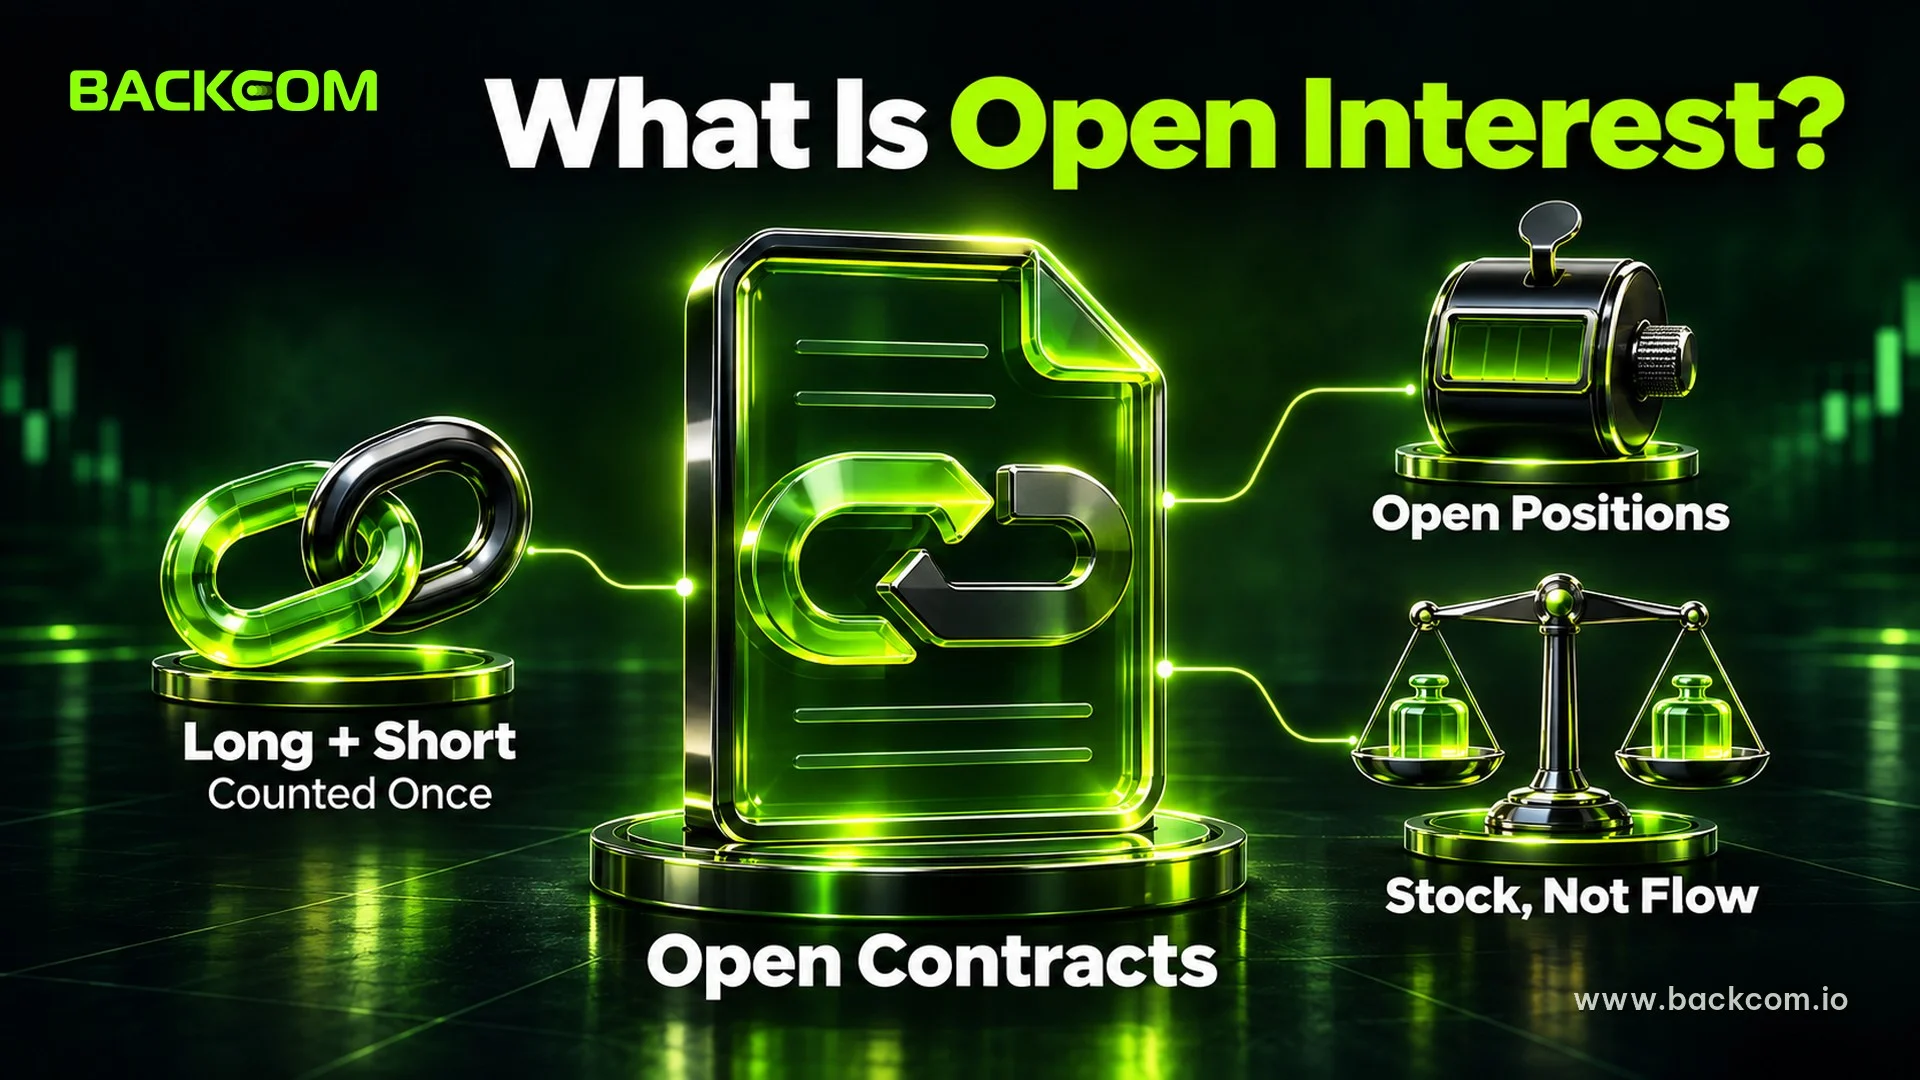
Open interest (OI) is a running count of contracts that are open at a given moment, so it measures how many positions are still alive. According to CME Group's education course, open interest is the total number of futures contracts held by market participants at the end of the trading day, and it is published at the end of each day on regulated futures markets. Crypto derivatives venues apply the same idea, though most show the figure live.
Every futures contract has two sides: a buyer (long) and a seller (short). The US CFTC explains in its Commitments of Traders notes that open interest is the total of contracts entered into and not yet offset, and that all long open interest equals all short open interest. So OI counts each long-and-short pair once, not twice.
Three points keep the concept clear:
- It counts open positions: a contract stays in OI until someone closes it, it is liquidated or it expires.
- It is a stock, not a flow: it is a balance that rises and falls, like the number of cars parked in a lot.
- It is not a price: OI says nothing about direction on its own.
How Is Open Interest Calculated?
Open interest changes only when a trade creates or removes a position. CME explains that the figure is built by adding contracts from newly opened trades and subtracting contracts from trades that are closed. The result follows four simple cases:
| What happens | Effect on OI |
|---|---|
| A new buyer and a new seller open a position | OI goes up |
| An existing long and an existing short both close | OI goes down |
| A new trader takes over an existing position from a trader who exits | OI stays the same |
| One trader closes a position by trading against a trader opening a new one | OI stays the same |
Reference: CME Group, "Open Interest", introduction-to-futures course, checked on 3 November 2026.
The liquidation of a leveraged position also removes contracts from OI. That is why OI often drops sharply in a fast price move, a point we return to below.
Open Interest Meaning In Crypto Futures
In crypto, open interest usually refers to perpetual futures and dated futures, shown either in coin units or in dollar value. Perpetual contracts have no expiry date, so positions can stay open for weeks and OI can build up without the forced roll-off you see in dated contracts.
Two details are worth knowing before you read any chart:
- Units differ. One venue may show OI in contracts, another in coins, another in USD. A rising dollar figure can partly reflect a higher price, not new positions.
- Venues differ. The OI shown by one exchange covers only that exchange. Aggregator sites add several venues together, and their methods are not identical.
Why Do Traders Watch It?
Traders watch open interest because it shows whether new money is entering a move or an existing move is running out of fuel. Price alone cannot tell you that. A rally with many fresh positions is a different situation from a rally caused by shorts closing.
Open interest also hints at how much leverage is in the system. A large number of open leveraged positions means more potential forced selling or buying if price moves against the crowd. For the mechanics behind forced exits, read our guide on how to calculate liquidation price.
Open Interest Vs Volume: What Is The Difference?
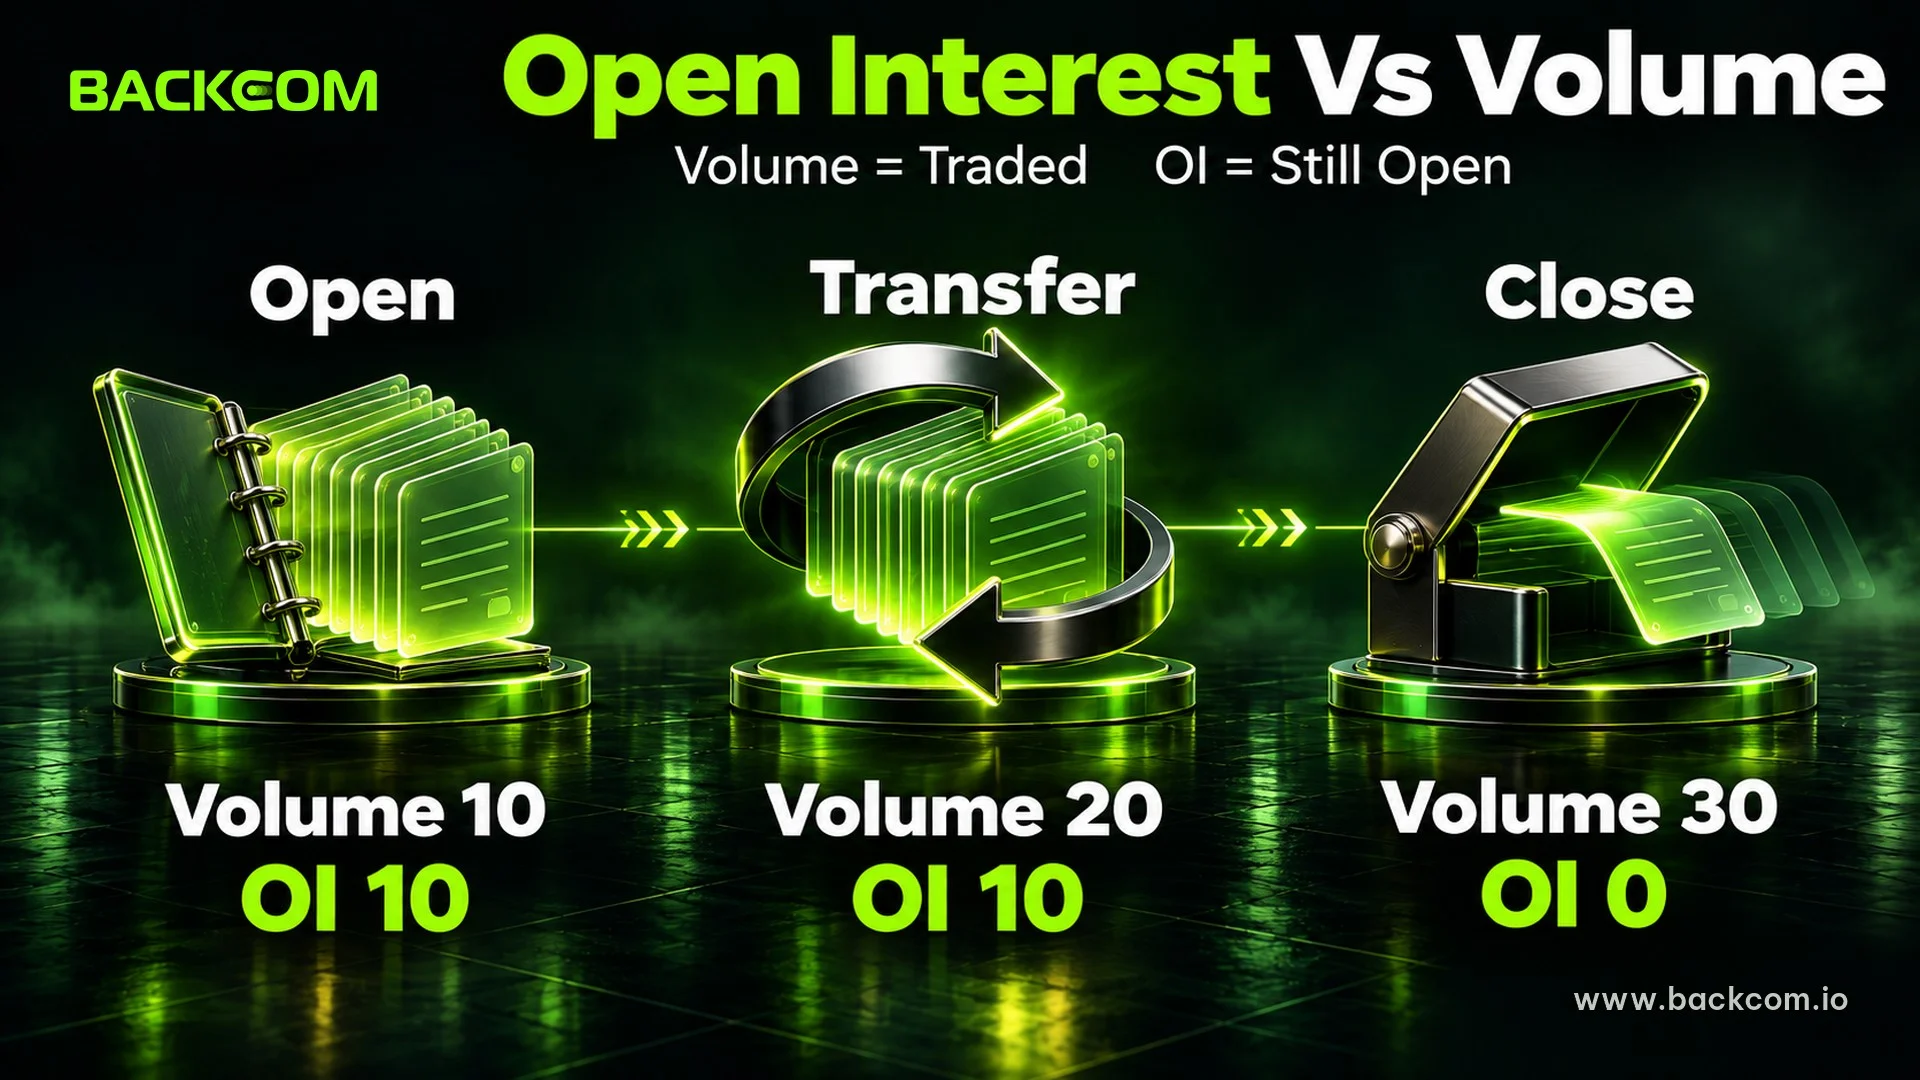
Volume counts every contract traded during a period, while open interest counts only the contracts that remain open. CME states the same split: volume measures trading activity, and open interest measures the positions still outstanding.
| Point | Volume | Open interest |
|---|---|---|
| What it counts | Contracts traded in a period | Contracts still open |
| Type of measure | Flow, resets each period | Stock, carries forward |
| Can it fall? | It restarts from zero each period | Yes, when positions close |
| Question it answers | How active was trading? | How many positions are still alive? |
A Worked Example
Imagine a quiet market where nobody holds a position. Trader A buys 10 contracts from Trader B, who sells 10. Volume is 10 and OI is 10.
Next, Trader A sells those 10 contracts to Trader C, who buys them. Volume for the period is now 20, but OI is still 10, because the same ten contracts simply changed hands.
Finally, Trader C and Trader B both close their positions against each other. Volume rises to 30, and OI falls back to 0. This is why high volume with flat OI often means a lot of turnover between traders, not new commitment.
How To Read Rising Open Interest Price Moves
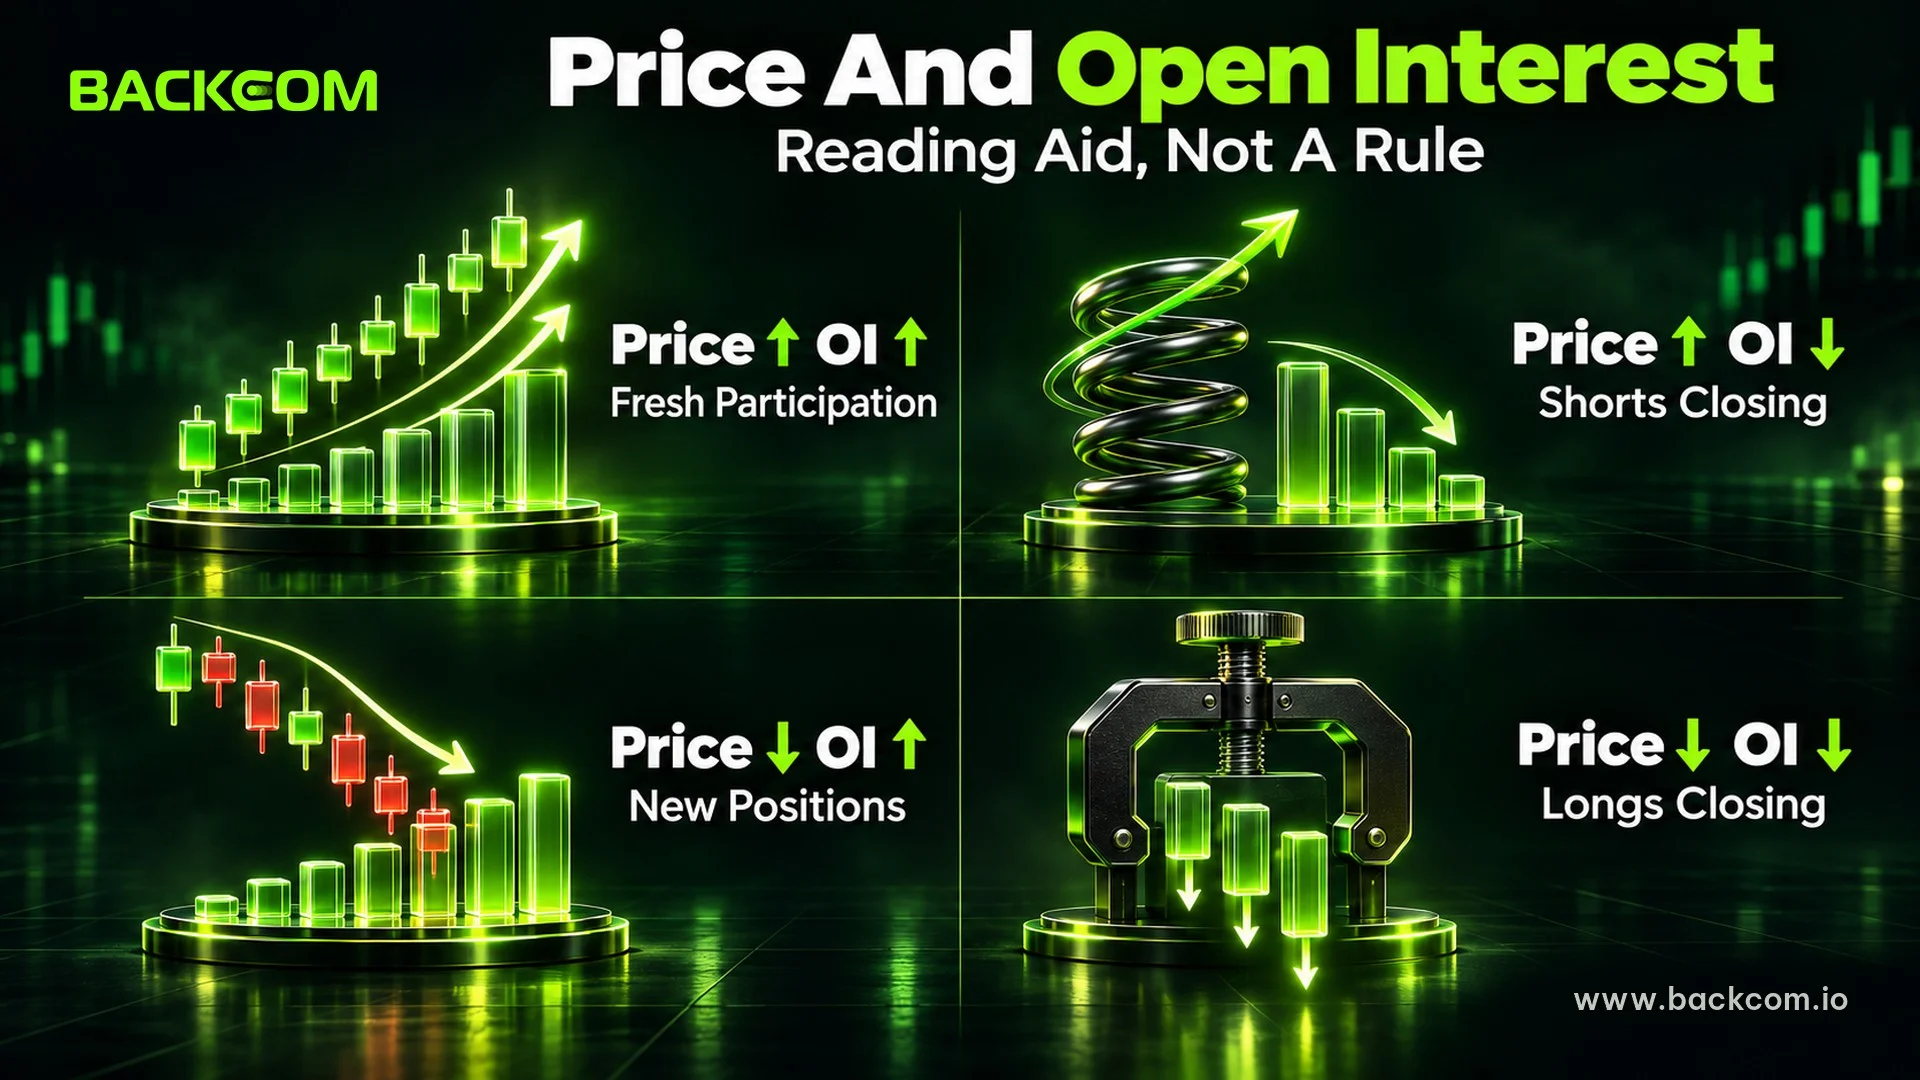
Rising open interest means new positions are being opened, and what it implies depends on which way price is moving. Many market educators use the four-way grid below as a starting point. Treat it as a reading aid, not a rule, because no pairing is reliable on its own.
| Price | Open interest | Common reading |
|---|---|---|
| Rising | Rising | New money is joining the uptrend; the move has fresh participation |
| Rising | Falling | Shorts may be closing; the rally has less new support |
| Falling | Rising | New positions, often shorts, are pressing the downtrend |
| Falling | Falling | Longs are closing or being liquidated; the sell-off may be maturing |
Rising Price With Rising Open Interest
When price and OI climb together, traders often read the trend as supported by fresh capital. That does not make the move safe. New longs can be late buyers, and a crowded long side becomes a source of selling if price turns.
Falling Price With Rising Open Interest
Falling price with rising OI shows that new positions are being opened into a decline. They may be shorts adding to the trend, or longs averaging down. OI alone cannot say which one it is, so look at other data before you decide.
Falling Open Interest After A Sharp Move
A sudden drop in OI after a big candle often points to liquidations and position closing rather than a new trend. After the forced selling or buying clears, the market can look calmer simply because fewer leveraged positions remain. Do not assume the move will reverse, because a clearing of positions is not a signal by itself.
Open Interest And Funding Rate Together
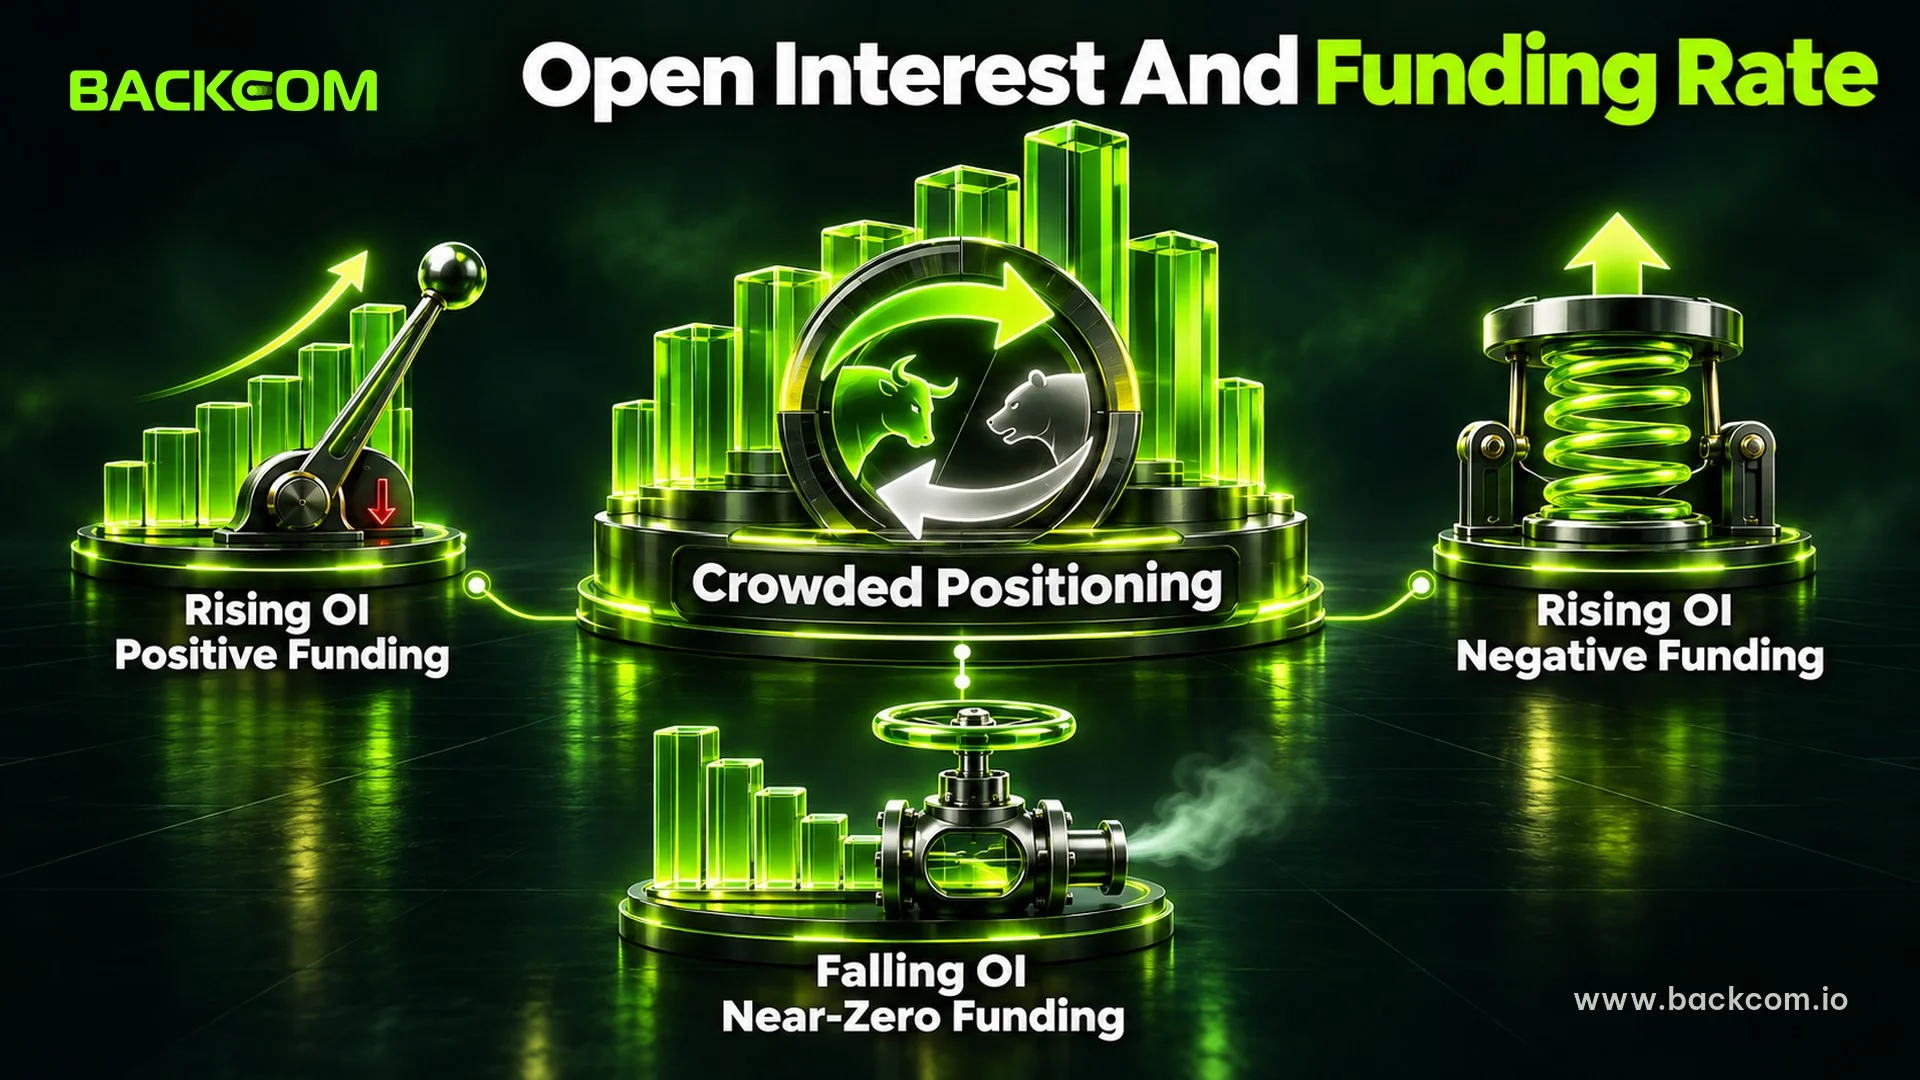
Open interest shows how large the leveraged crowd is, and the funding rate shows which side of the crowd is paying. On perpetual futures, funding is the payment exchanged between longs and shorts to keep the contract close to the spot price. When funding is positive, longs pay shorts, and when it is negative, shorts pay longs. If you are new to it, start with our guide on what the funding rate is.
Reading the two together:
- Rising OI with high positive funding: the market is leaning long and paying for it. A crowded trade like this can be vulnerable to a sharp drop if price slips.
- Rising OI with negative funding: shorts are building even though they pay to hold. That shows conviction, but it also leaves room for a squeeze if price jumps.
- Falling OI with funding near zero: leverage is being reduced and the market is less crowded.
These are probabilities, not predictions. Positioning can stay crowded for a long time.
Why Margin Mode Matters
The way your account shares collateral decides how a crowded market can hurt you. In a fast move, positions can be liquidated even when your idea was right. Learn the difference in our article on cross margin vs isolated margin before you trade leveraged products.
Limits Of Open Interest As A Signal
Open interest is context, not a trading signal, and it has clear blind spots. Keep these limits in mind:
- No direction. OI cannot tell you whether the new positions are long or short, only that they exist.
- No view of the trader. A hedge and a speculative bet look identical in the number.
- Unit and venue effects. A rise measured in USD can come from price alone, and one venue never shows the whole market.
- Data delays. Different sources update at different speeds, so compare timestamps.
- Noise around expiries. Dated contracts reduce OI as they settle, which can look like a market signal when it is not.
Combine OI with price structure, funding and your own risk limits, and never size a position on one indicator.
How To Use Open Interest In A Simple Routine
A simple routine keeps open interest in its place as one input among several. Try this checklist:
- Check units and venue so you know what the chart measures.
- Compare OI with price using the four-way grid above.
- Look at funding to see which side is crowded.
- Note the leverage risk and keep your own position sized so a forced exit would not hurt badly.
- Write down your reading and review it later to learn which setups worked for you.
Leveraged futures can lose money quickly, and most of this data describes the past, not the next candle.
Frequently Asked Questions (FAQ) About Open Interest
What Is Open Interest In Simple Words?
Open interest is the number of futures or perpetual contracts that are still open and not yet closed or settled. It shows how many positions exist in a market at a given moment. A higher number means more positions are alive, but it does not say whether they are long or short.
Is High Open Interest Bullish Or Bearish?
Neither on its own. High or rising OI shows that many positions are open, not which direction they favour. Read it with price and funding: rising price with rising OI can indicate fresh participation, while the same OI with extreme funding can point to a crowded trade.
What Is The Difference Between Open Interest And Volume?
Volume counts all contracts traded in a period, and open interest counts only the contracts that remain open. If two traders swap an existing position, volume increases but open interest does not change. Volume is a measure of activity; open interest is a measure of outstanding commitment.
Why Does Open Interest Fall During A Crash?
Open interest falls when positions close, and a crash forces many to close through liquidations. When leveraged longs hit their liquidation price, their contracts are removed from the market, so the total drops. A fall in OI after a crash usually reflects cleared positions, not a new trend.
Where Can I Find Open Interest Data?
Most derivatives exchanges show open interest on the page for each futures contract, and several data sites aggregate figures across venues. Check which units and exchanges a chart covers, because a mismatch can make two sources look very different.
Conclusion: Treat Open Interest As Context
What is open interest? It is a count of positions that are still open, and it helps you judge whether a price move has new participation behind it. Pair it with price, funding and a clear risk limit, and remember that it shows size, not direction. Backcom.io publishes this guide for education, so practise reading the data before you risk real money.
Disclaimer: This content is compiled by Backcom.io for information only and is not investment advice. Crypto derivatives carry a high risk of loss, including the loss of your whole deposit. Rules and taxes differ by country, so check the requirements that apply to you before trading.
Was this article helpful?
Join The Backcom.io Community
Get the latest on trading rebates, trading tips, and broker deals — and connect with thousands of traders worldwide.

Backcom App
Track Your Rebates Every Day
Every rebate is visible by broker and by day. Manage your wallet and withdrawals in one place.
Open Backcom App