What Is PMI Forex? How To Read Manufacturing And Services PMI For Gold And USD


At the start of every month, before payrolls or inflation print, markets already have one number to judge whether the economy is heating up or cooling down. What is PMI forex is the first question traders ask, and the answer is short: a survey of purchasing managers that tends to move before the official statistics do. That is why USD and gold can jump at 14:00 or 15:00 UTC with no Fed or jobs headline in sight.
In this article, Backcom.io walks through the questions traders search most:
- What PMI is and the diffusion index formula behind the number.
- Which manufacturing PMI components make up the headline, and how the ISM manufacturing PMI differs from the S&P Global version.
- What a PMI above 50 means, why 50 is the dividing line, and why the number alone says little.
- How PMI news moves forex, especially USD and gold, with a checklist for staying safe around the release.
What Is PMI Forex? A Survey Of Purchasing Managers That Gauges Economic Health
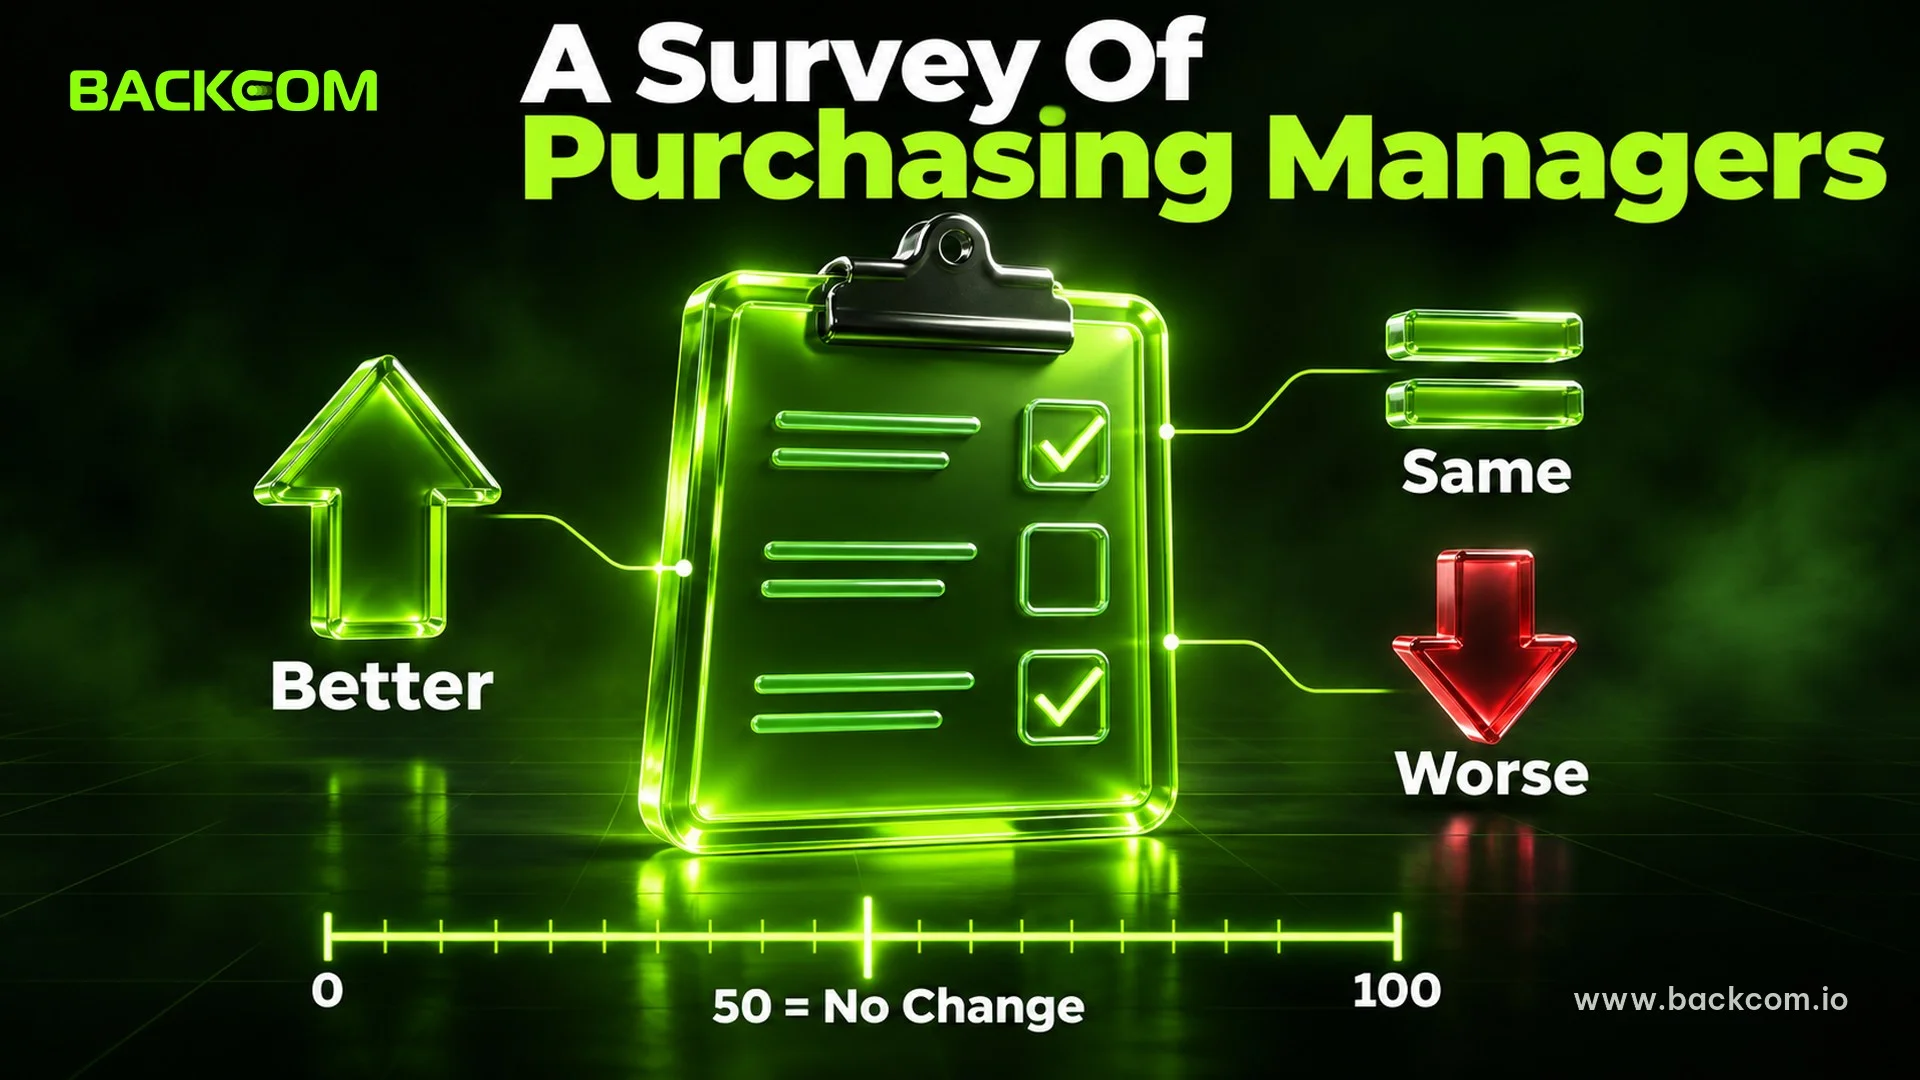
What is PMI? PMI (Purchasing Managers’ Index) is a monthly survey that asks purchasing managers whether business conditions this month are better, the same or worse than last month. The answers are combined into a scale from 0 to 100, where 50 means no change.
Speed is what makes PMI useful. Purchasing managers see new orders, inventories and delivery times before those changes show up in GDP or industrial output, so PMI is usually treated as a leading indicator that sits ahead of the economic cycle rather than behind it.
GDP and inflation are the opposite: lagging indicators that only confirm what already happened, as in the guide to what GDP is and how US GDP moves markets.
For a direct reference, see the PMI overview on Wikipedia.
PMI Formula: How The Diffusion Index Works
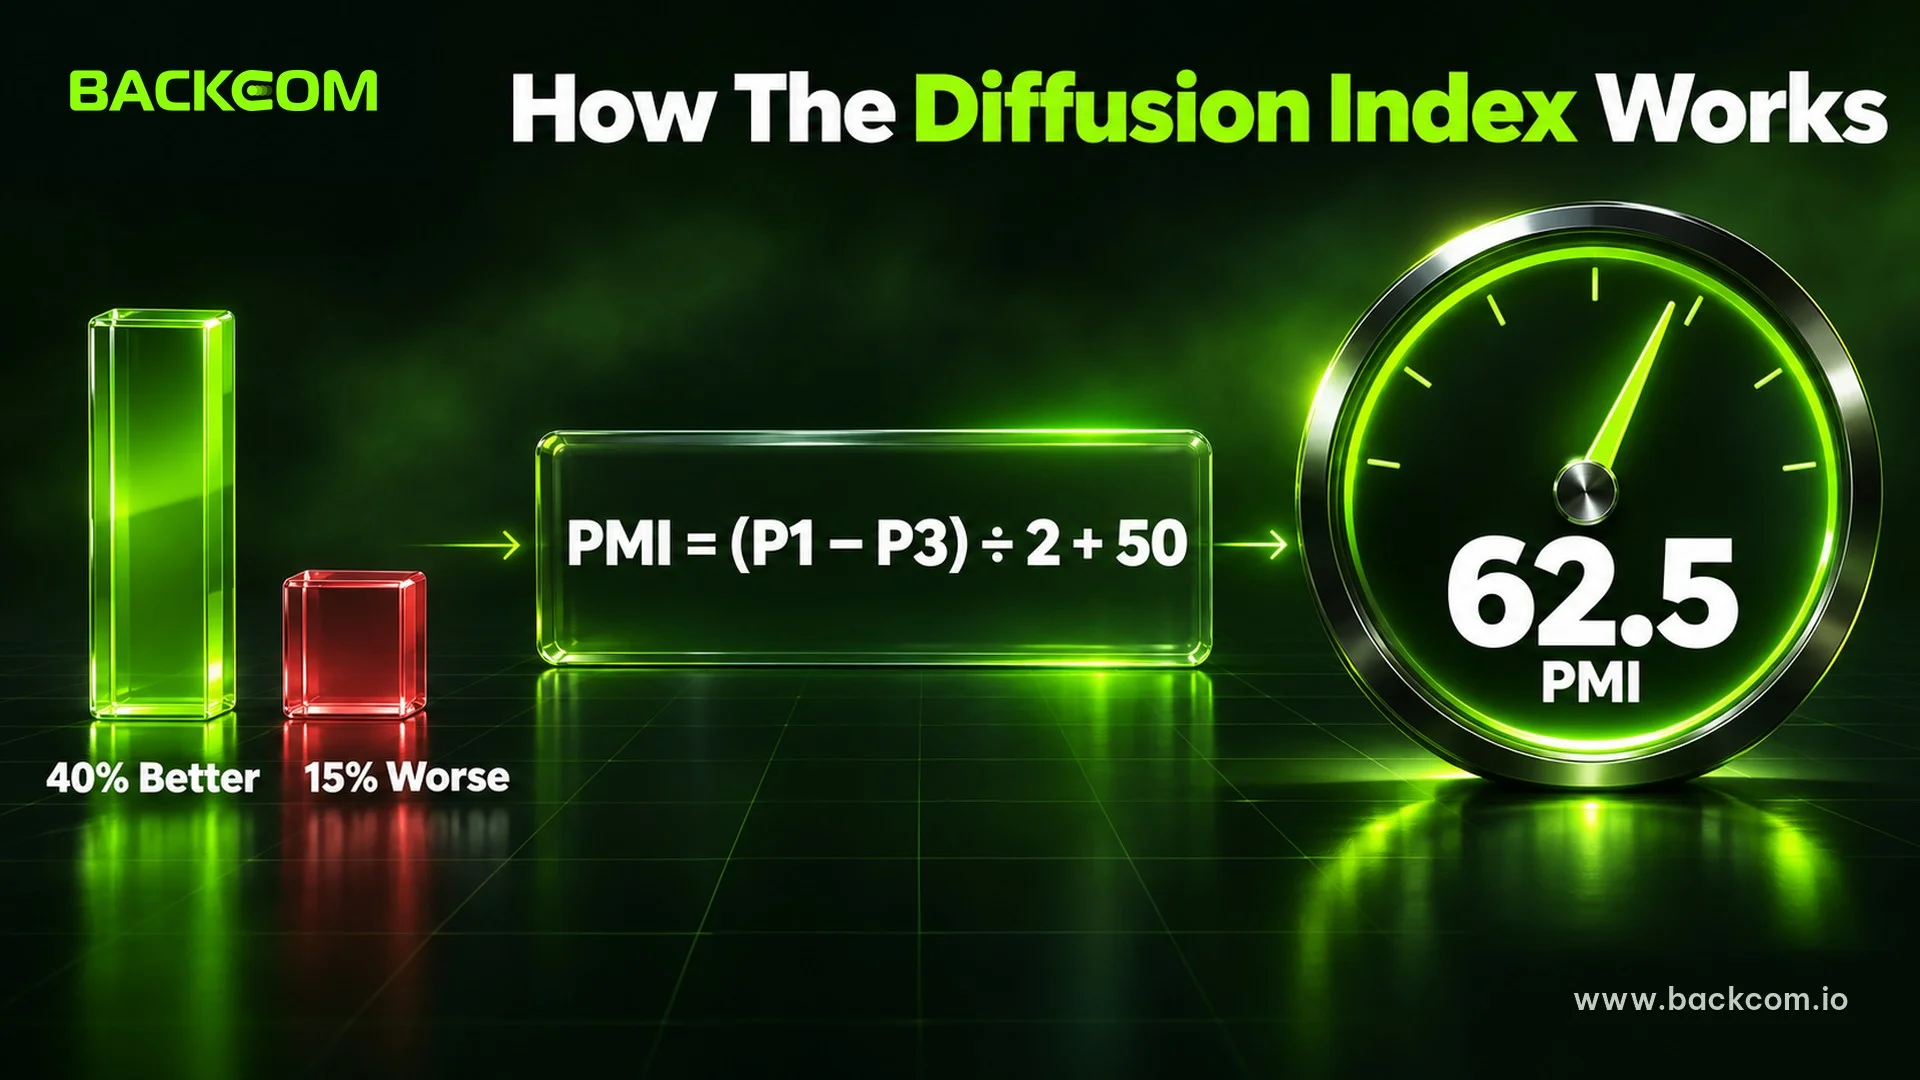
PMI is calculated as a diffusion index, which counts the share of firms reporting improvement minus the share reporting deterioration. Let P1 be the percentage reporting better conditions, P2 the percentage reporting no change and P3 the percentage reporting worse conditions. The simplified formula is:
PMI = (P1 − P3) ÷ 2 + 50
Take a hypothetical survey where 40% of firms report better orders, 45% report no change and 15% report worse orders. The index is (40 − 15) ÷ 2 + 50 = 62.5. If the better and worse shares are equal, the index sits at exactly 50, no matter how many firms report no change.
Two consequences matter for traders:
- PMI measures direction, not size: a firm whose orders rose 1% and a firm whose orders rose 30% both count as “better”.
- PMI compares with last month, not last year: the index can sit above 50 while output is still below an earlier peak.
What Are The Manufacturing PMI Components?
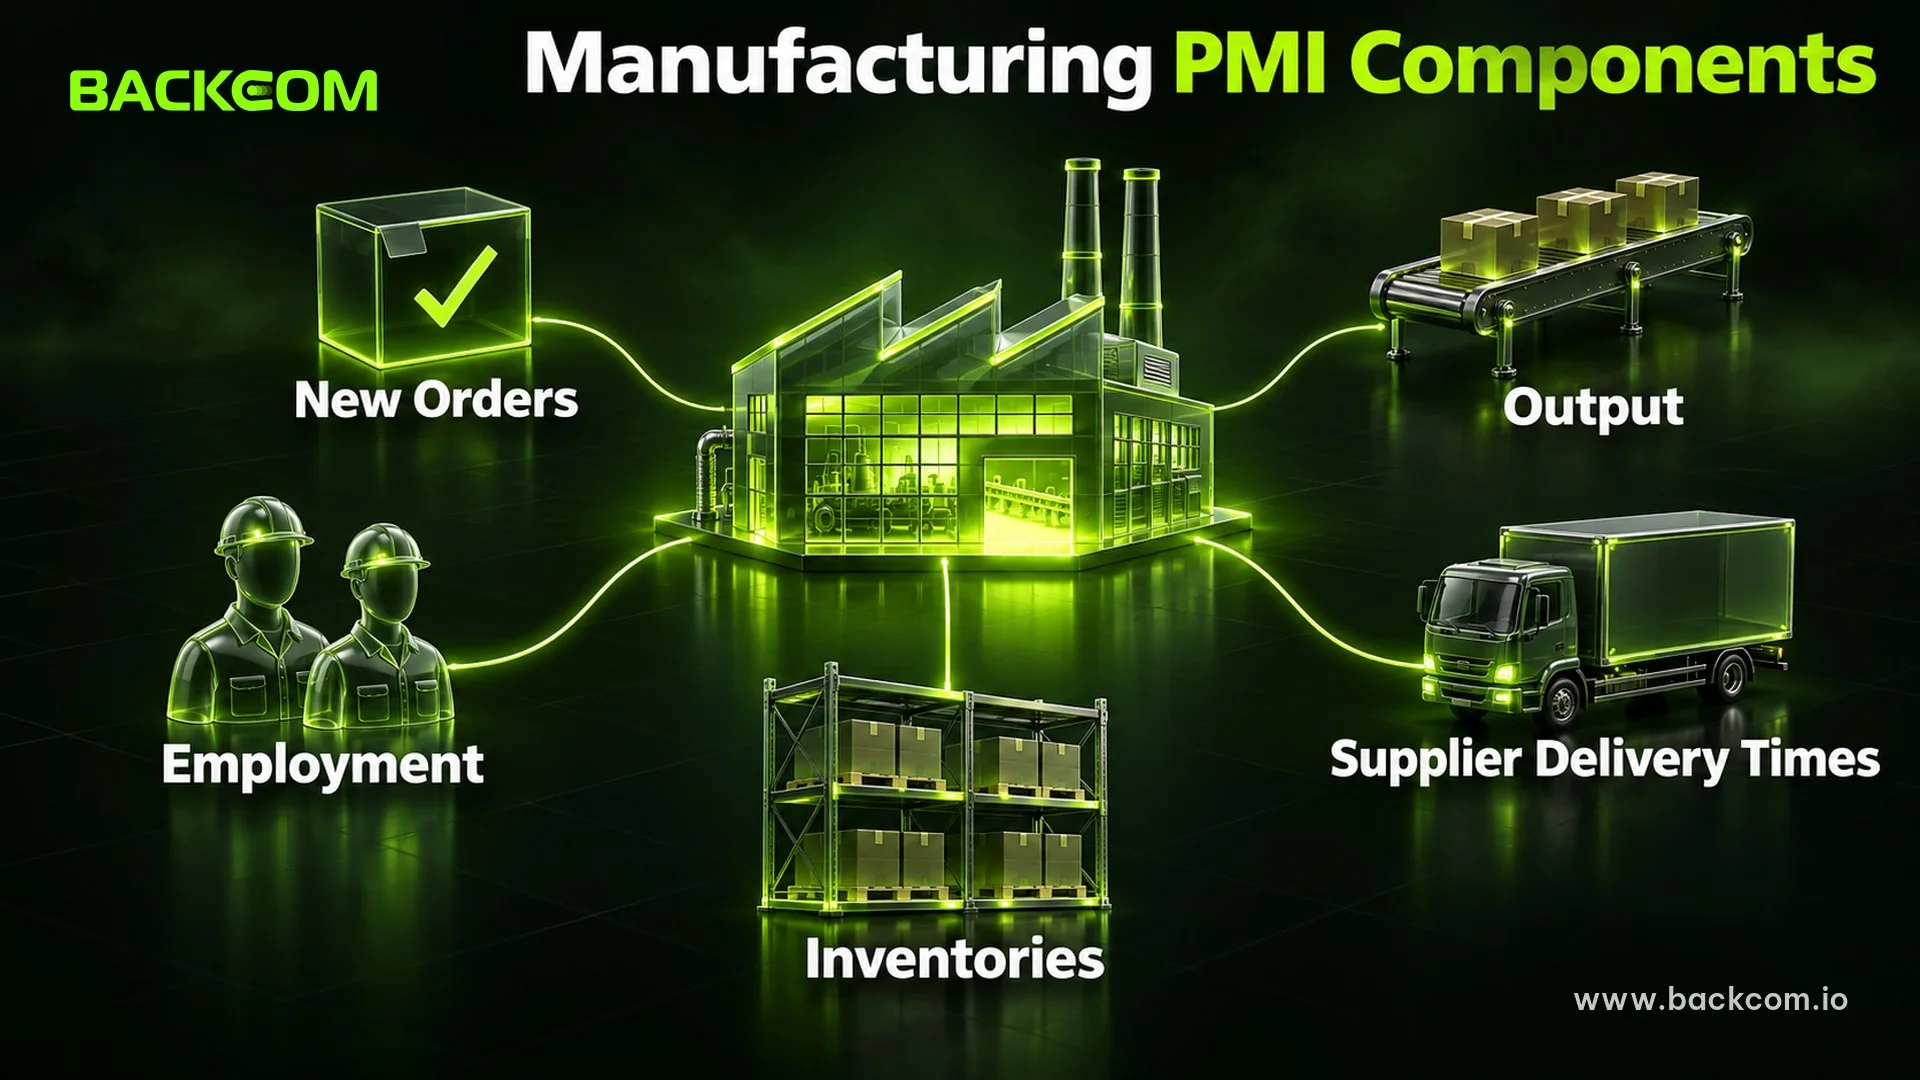
Manufacturing PMI is the most watched version and measures conditions in factories. The headline number is built from five component indexes: new orders, output, employment, supplier delivery times and inventories of purchases.
The table below compares how the two most common sources weight those components:
| Component | ISM Manufacturing PMI | S&P Global Manufacturing PMI |
|---|---|---|
| New orders | 20% | 30% |
| Output | 20% | 25% |
| Employment | 20% | 20% |
| Supplier delivery times | 20% (inverted) | 15% (inverted) |
| Inventories of purchases | 20% | 10% |
Calculation method as described on Wikipedia, checked on 3 November 2026. Weights and methodology can change, so confirm on the official ISM and S&P Global pages before relying on them.
The “inverted” label on delivery times is often misread. When suppliers deliver more slowly, that component rises and lifts the headline, because slower deliveries usually appear when demand outruns supply. But slow deliveries can also come from supply chain bottlenecks, so a high PMI driven by this component does not necessarily mean strong demand.
The key point is to open the component table rather than read only the headline. A PMI of 51 with falling new orders and slower deliveries is a very different picture from a 51 with strongly rising new orders.
ISM Manufacturing PMI: How It Differs From The S&P Global PMI
The ISM manufacturing PMI is the index published by the Institute for Supply Management, a US supply management association. ISM publishes two versions: the Manufacturing PMI for factories and the Services PMI for the service sector. For USD traders it is usually the most watched PMI because it arrives early in the month and relates to the world’s largest economy.
As described generally on Wikipedia, manufacturing PMI is typically released on the first business day of the month and services PMI on the third. ISM lists its releases at 10:00 a.m. US Eastern Time on its report calendar, which is 14:00 UTC in US summer time and 15:00 UTC in winter. Check the exact date on the economic calendar, since public holidays can shift the schedule.
Three differences between sources:
- Publisher: ISM is an association, S&P Global is an independent data company, and each uses its own survey panel.
- Component weights: as the table shows, ISM weights five parts equally while S&P Global leans toward new orders.
- Timing: S&P Global also publishes a flash estimate near the end of the month, roughly a week before the final figure, with dates listed on the S&P Global PMI release calendar.
So two indexes both called “US PMI” can differ by several points in the same month, and a release should only be compared with the forecast for that same source.
What Does A PMI Above 50 Mean? Reading Expansion And Contraction
A PMI above 50 means more firms report improving conditions than worsening ones, so the surveyed sector is expanding compared with last month. Below 50 is contraction, and exactly 50 is no change.
Read it in three layers:
- The 50 line: it shows direction. A move from 49.8 to 50.2 is a change of direction, but a small one that can reverse next month.
- Multi-month trend: three months in a row up or down is more reliable than a single cross of 50.
- Internal components: new orders and employment show demand, while input prices show inflation pressure.
One important caution: a PMI above 50 does not mean fast growth, because 50.5 and 58 are both expansion but very different in strength. Likewise, a manufacturing PMI below 50 for a long stretch does not automatically signal recession, because manufacturing is only one part of the US economy.
As with CPI, the market cares about the gap between actual and forecast, not the number itself. A PMI of 52 against a forecast of 53 is often read as bad news even though it is still expansion.
How Does PMI News Affect Forex? The Impact On USD And Gold
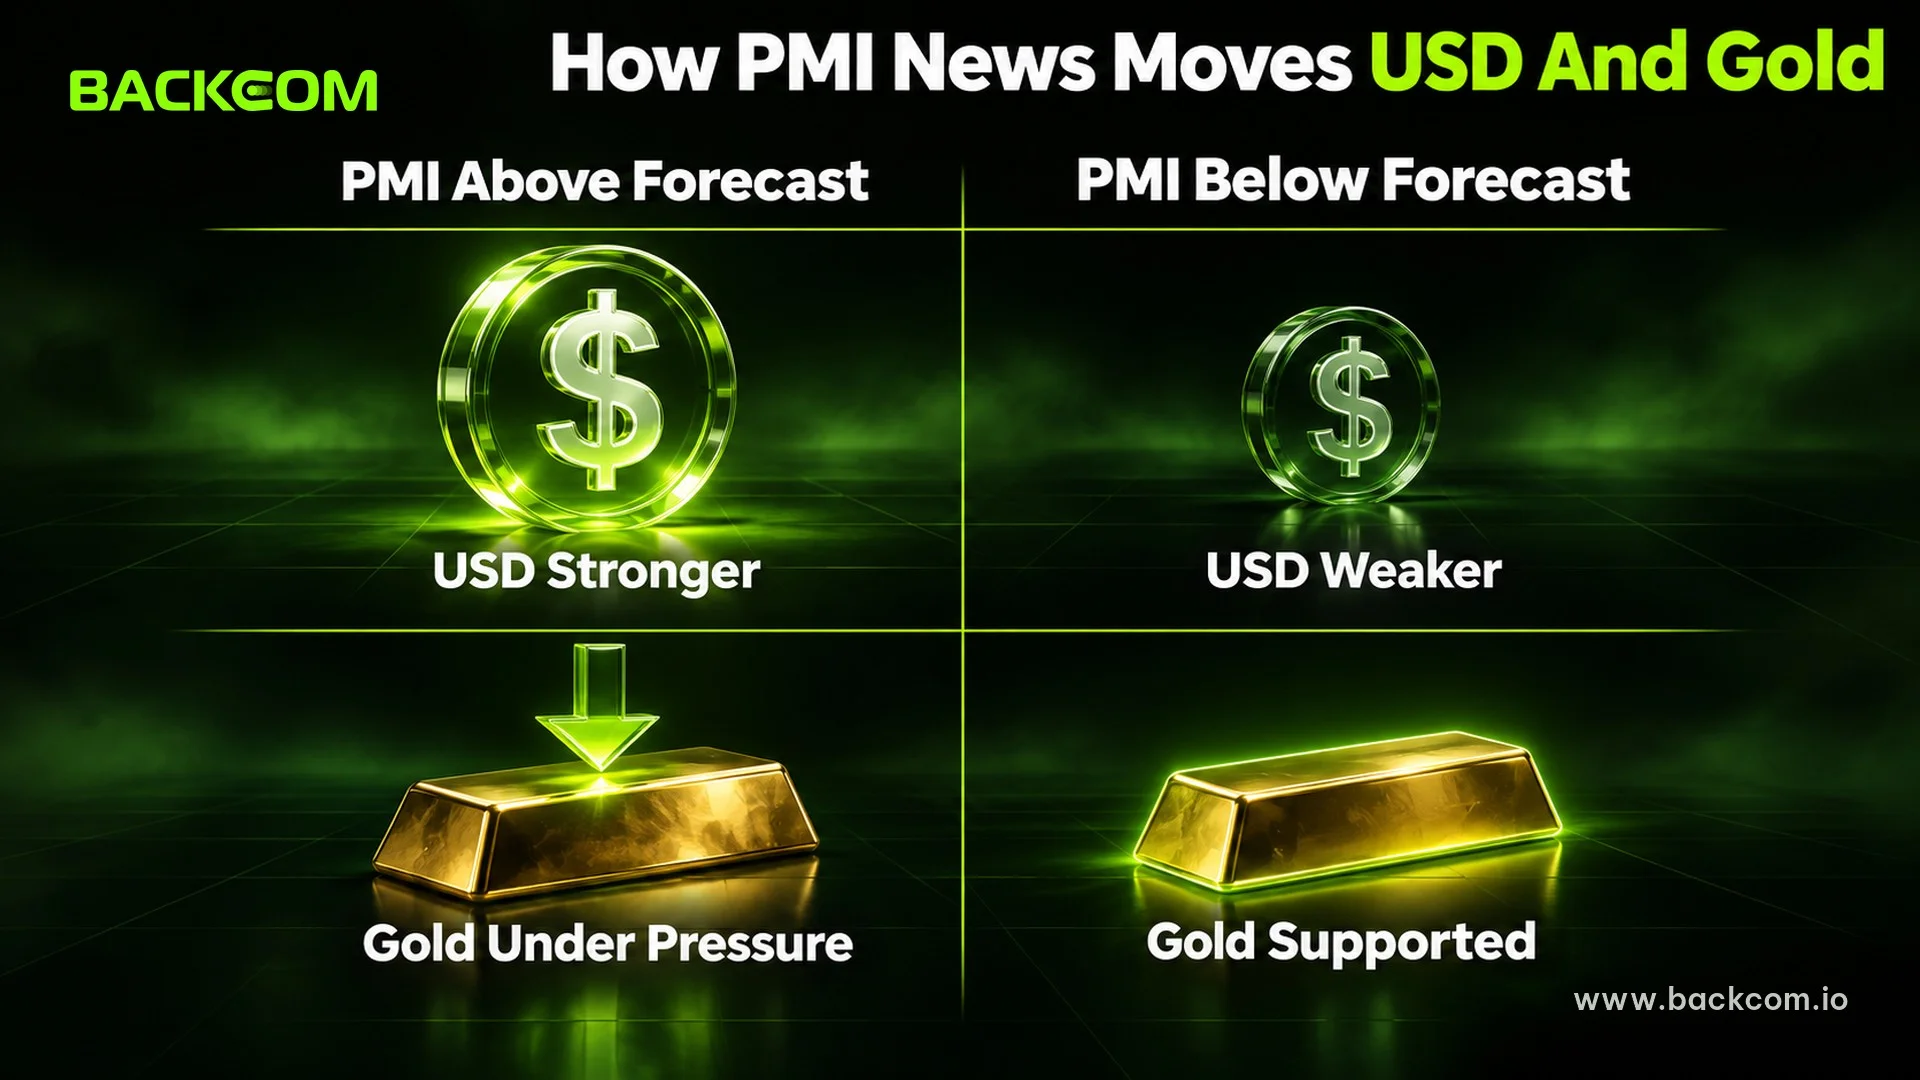
PMI news affects forex through a familiar chain: a strong PMI suggests a hot economy, higher rate expectations, rising bond yields, a stronger USD and pressure on gold. A weak PMI reverses the chain. This is a common tendency, not a rule, and the real reaction depends on context.
The table below shows the typical pattern:
| PMI versus forecast | Rate expectations | USD usually | Gold usually |
|---|---|---|---|
| Clearly above forecast | Tend to rise | Stronger | Under pressure |
| In line with forecast | Little change | Mild moves | Mild moves |
| Clearly below forecast | Tend to fall | Weaker | Often supported |
Illustration of commonly seen reactions, not a promise about direction. Real moves depend on the rate cycle, market positioning and other news at the same time.
Four situations break the chain, and traders should know them in advance:
- Two readings of a weak PMI: when markets fear inflation, a weak PMI can raise Fed cut expectations and push USD lower, but it can also be read as recession risk and trigger a flight to USD.
- Price components pointing the other way: a weak headline with sharply rising input prices can muddy the reaction. Inflation readings are covered in the guides to PPI and PCE.
- Overlap with major news: in weeks with payrolls, CPI or a Fed meeting, PMI is easily overshadowed. See what Nonfarm Payrolls are and the FOMC meeting schedule.
- PMI from other economies: eurozone or UK PMI moves EUR and GBP by the same logic.
For gold, the main channel runs through USD and yields, so the guide to the Fed, interest rates, gold and USD is useful background.
How To Read PMI News And Trade Safely Around The Release
Traders should build the habit of reading PMI before thinking about an entry. The five steps below work for both ISM and S&P Global:
Step 1: Record the forecast and the previous figure
Open the economic calendar and note three numbers: forecast, previous and the actual print. The gap between actual and forecast is the real news.
Step 2: Read new orders and employment first
These two components reflect demand and the labor market, and they often carry more predictive value than the headline.
Step 3: Check the input price index
Sharply rising input prices mean inflation pressure, which affects rate expectations.
Step 4: Cross-check with hard data
PMI is a sentiment survey, so compare it with hard data such as the Fed’s industrial production release or jobs numbers. When the two disagree, wait a few more releases to see which one turns.
Step 5: Decide whether to trade or stay out
No release forces a trade. Staying out of one release is a valid decision.
If you do trade, these rules reduce risk:
- Use a smaller lot than usual, because spreads can widen and price can slip when the news hits.
- Set the stop loss before the release and leave room for slippage instead of hoping for a fill at the exact price.
- Wait a few minutes for price to settle instead of chasing the first spike.
Before sizing a trade around a release, use the position size calculator to cap risk at the amount you accept to lose, and compare spreads and trading conditions across brokers on the broker page.
Backcom.io is an independent introducing broker (IB/affiliate) of the brokers listed; rebates are paid from the commission the broker pays Backcom.io — see the risk disclaimer.
Common Mistakes When Reading PMI
Most PMI errors come from treating it as an automatic buy or sell signal. These three repeat most often:
1. Treating a PMI above 50 as a signal to buy USD
PMI only shows the direction of the survey. Price reaction also depends on what the market had already priced in.
2. Ignoring the forecast
A high PMI that misses the forecast is often sold. The market reacts to surprise, not to the absolute level.
3. Trading the very first seconds
Spreads widen, liquidity thins and slippage is highest in the first few seconds.
There is no “buy or sell at this PMI level” number, because no threshold fits every cycle. What can be standardized is the reading routine, disciplined position sizing and checking figures against the original source before relying on them.
Frequently Asked Questions (FAQ) About PMI
What Is PMI And How Is It Different From GDP?
PMI is a monthly sentiment survey of purchasing managers, while GDP is the official statistic for the value of the whole economy, published quarterly. PMI arrives sooner but only shows direction, not scale. Traders therefore use PMI to anticipate trends and GDP to confirm them.
What Does A PMI Above 50 Mean For Traders?
A PMI above 50 means the surveyed sector is expanding compared with last month, not necessarily growing strongly. For traders, the result against forecast and the multi-month trend matter more. A narrow cross of 50 can easily reverse the following month.
What Is The ISM Manufacturing PMI And When Is It Released?
The ISM manufacturing PMI is the Institute for Supply Management index, published as a manufacturing version and a services version. As generally described, manufacturing comes out on the first business day of the month and services on the third, usually at 10:00 a.m. US Eastern Time. Confirm exact dates on the economic calendar, as holidays can shift the schedule.
How Strongly Does PMI News Affect Forex And Gold?
PMI news usually causes a moderate move but can be sharp when the result is far from forecast. The reaction differs from month to month, so reducing lot size and setting the stop loss in advance is the cautious approach.
Conclusion: Use PMI As One Piece Of The Puzzle, Not The Only Signal
What is PMI forex can be summed up in one sentence: a survey index that measures the direction of business conditions, with 50 as the line between expansion and contraction. Traders need to look at three things together: actual versus forecast, the components inside the headline, and the current rate policy backdrop.
Before each release, record the forecast and previous figure, read new orders and prices, cross-check with hard data, then cut lot size or stay out if the release overlaps another major event. To build the macro picture around PMI, read CPI, Nonfarm Payrolls and the FOMC in that order.
Disclaimer: This content is compiled by Backcom.io for information and reference only and is not investment advice, a trading recommendation or tax or legal advice. Trading forex, gold and leveraged products carries a high level of risk and you may lose all of your capital. Figures and methodology can change, so check official sources before making any decision.
Was this article helpful?
Join The Backcom.io Community
Get the latest on trading rebates, trading tips, and broker deals — and connect with thousands of traders worldwide.

Backcom App
Track Your Rebates Every Day
Every rebate is visible by broker and by day. Manage your wallet and withdrawals in one place.
Open Backcom App