Fibonacci Retracement Forex: How To Draw It And Read The 38.2%, 50% And 61.8% Levels

Open almost any trader's chart and you will see horizontal lines labelled 23.6%, 38.2% and 61.8%. Many traders use them without knowing where the numbers come from or which two points the tool should be drawn between. Fibonacci retracement forex tools only work as a planning aid if you start from the right swing points, because a wrongly anchored tool produces levels that look precise and mean nothing.
In this article, Backcom.io will walk through what traders need to know:
- What Fibonacci is in trading and why the 38.2% and 61.8% ratios appear on charts.
- How to draw a Fibonacci retracement between two swing points, in both uptrends and downtrends.
- Fibonacci levels explained, with a close look at the 61.8% level and how to combine it with other tools.
- Fibonacci extension for profit targets, with a hypothetical worked example.
What Is Fibonacci In Trading? From A Number Sequence To A Chart Tool
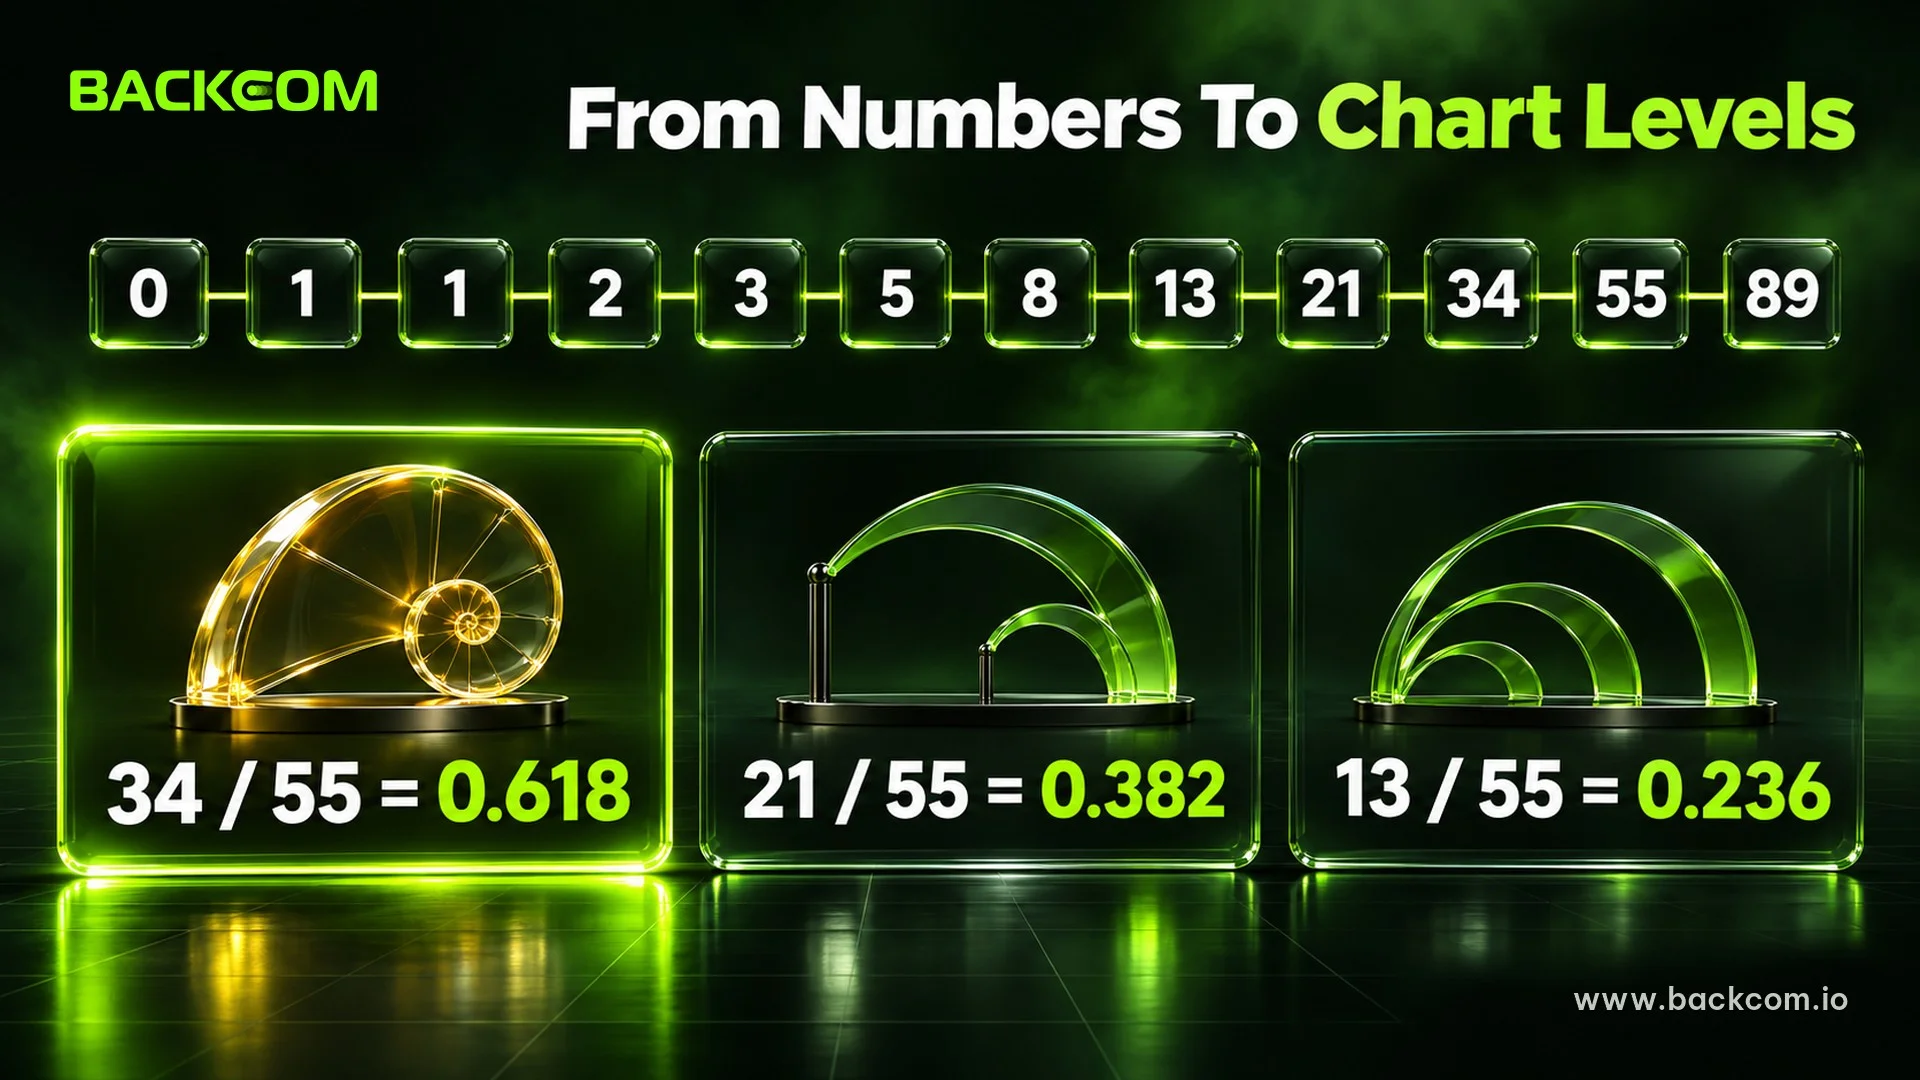
What is Fibonacci in trading? The name refers to a number sequence that starts with 0 and 1, where each number is the sum of the previous two: 0, 1, 1, 2, 3, 5, 8, 13, 21, 34, 55, 89, 144. The mathematician Leonardo of Pisa, known as Fibonacci, introduced it to Europe in his 1202 book Liber Abaci, according to Wikipedia's page on the Fibonacci sequence.
Traders care about the ratios between neighbouring numbers. Divide a number by the one right after it and the result approaches about 0.618, known as the golden ratio. Divide by the number two places later and it approaches 0.382. Three places later gives 0.236.
You can check these with a calculator:
- 34 ÷ 55 = 0.618: two adjacent numbers from the middle of the sequence.
- 21 ÷ 55 = 0.382: two numbers two places apart (21, 34, 55).
- 13 ÷ 55 = 0.236: two numbers three places apart (13, 21, 34, 55).
The 50% level is not a Fibonacci ratio, yet most platforms include it because traders have long watched the midpoint of a move. The 78.6% level is the square root of 0.618. So when someone talks about "Fibonacci levels", they are using a nearly fixed set of ratios, not a fresh calculation for each chart.
One point needs to be clear: there is no solid proof that financial markets follow these ratios. According to Wikipedia's entry on Fibonacci retracement, at least one academic study could not confirm the statistical significance of the levels. Treat Fibonacci as a way to divide a price move into reference zones, not as a law of the market.
Fibonacci Retracement Forex: The Two Main Tools
Fibonacci in forex usually appears as two tools on MetaTrader and similar platforms. If you are new to the market, start with forex trading for beginners. Each tool answers a different question, so you should not mix them up.
| Tool | Question it answers | Drawn from | Common levels |
|---|---|---|---|
| Fibonacci retracement | How far price may pull back | Swing low to swing high (or the reverse) | 23.6 / 38.2 / 50 / 61.8 / 78.6 |
| Fibonacci extension | How far price may travel | The same move, measured beyond its end | 127.2 / 161.8 / 261.8 |
Common levels referenced as at 2 November 2026. Default levels differ between platforms, and you can add or remove levels in the tool settings.
Retracement helps find an entry zone in the direction of the trend after a pullback. Extension helps set profit targets. Both start by identifying the correct swing, which is the next step.
How To Draw Fibonacci Retracement: Choosing The Right Two Swing Points
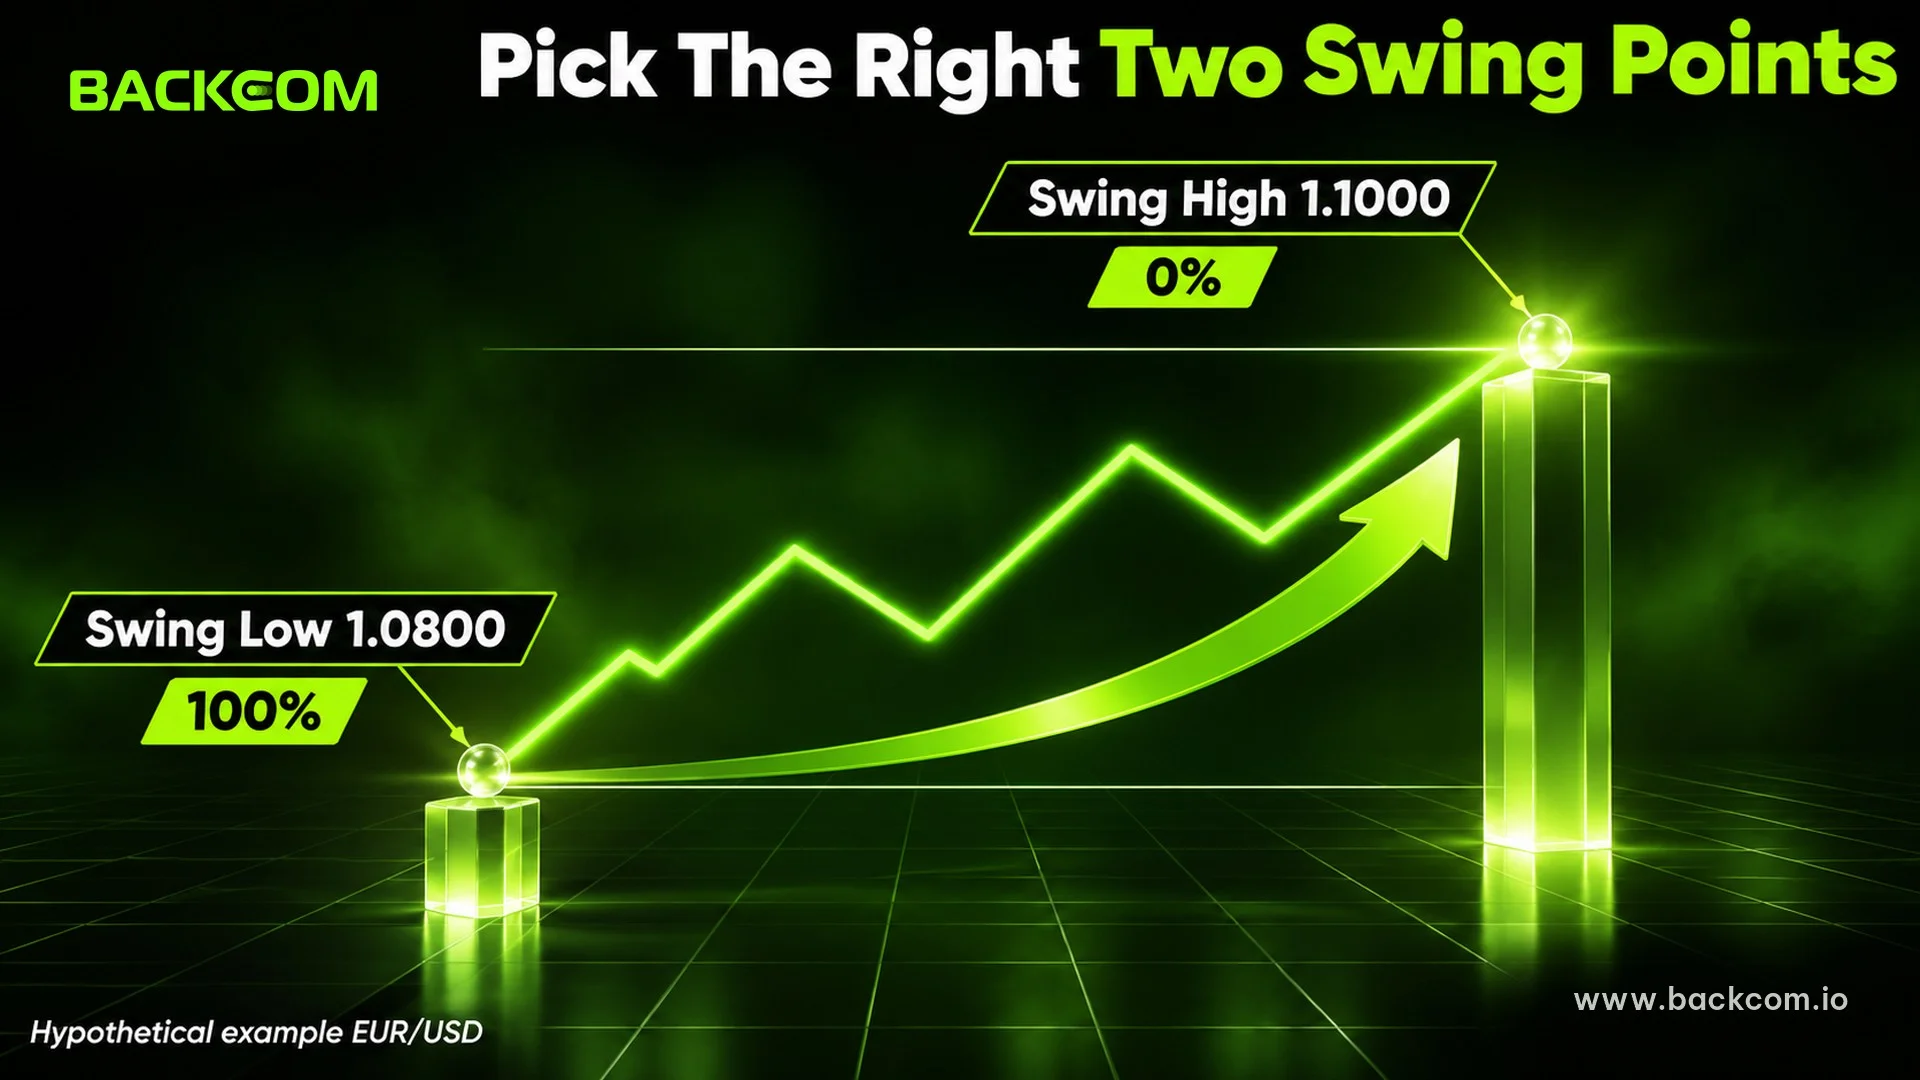
How to draw a Fibonacci retracement comes down to one core rule: drag from the start of the main move to the end of that move. If either point is wrong, every level that follows is shifted.
A swing point is a high or low where price clearly turns compared with the candles on either side. Decide the trend first, then pick the move to measure.
For an uptrend, the steps are:
- Find the latest upward move: from a swing low up to a clear swing high.
- Select the tool: in MetaTrader 5 it is Insert → Objects → Fibonacci → Fibonacci Retracement.
- Click the swing low: this point becomes the 100% level.
- Drag to the swing high and release: this point becomes the 0% level.
- Watch the pullback zone: the deeper price falls, the closer it gets to 100%.
For a downtrend, reverse the process. Drag from the swing high down to the swing low, and price retraces upward into the levels above the low.
A swing only matters if price has reacted there clearly, so skip points where price merely paused for a candle or two.
Common Drawing Mistakes
Most Fibonacci levels that "fail" were drawn wrongly. The usual mistakes are:
- Mixing wicks and candle bodies: choose wicks (highs and lows) or bodies, then use the same choice for both points.
- Measuring a tiny move: swings of a few candles produce levels that overlap with ordinary noise.
- Redrawing until a level fits: moving the anchor points until one level "works" is self-persuasion, not analysis.
- Drawing in the wrong direction: the wrong order flips the whole set of levels, so the entry zone ends up on the wrong side.
You should therefore write down your swing-selection rule first and apply it the same way on every chart.
Fibonacci Levels Explained: How To Read The 61.8% Level And The Rest
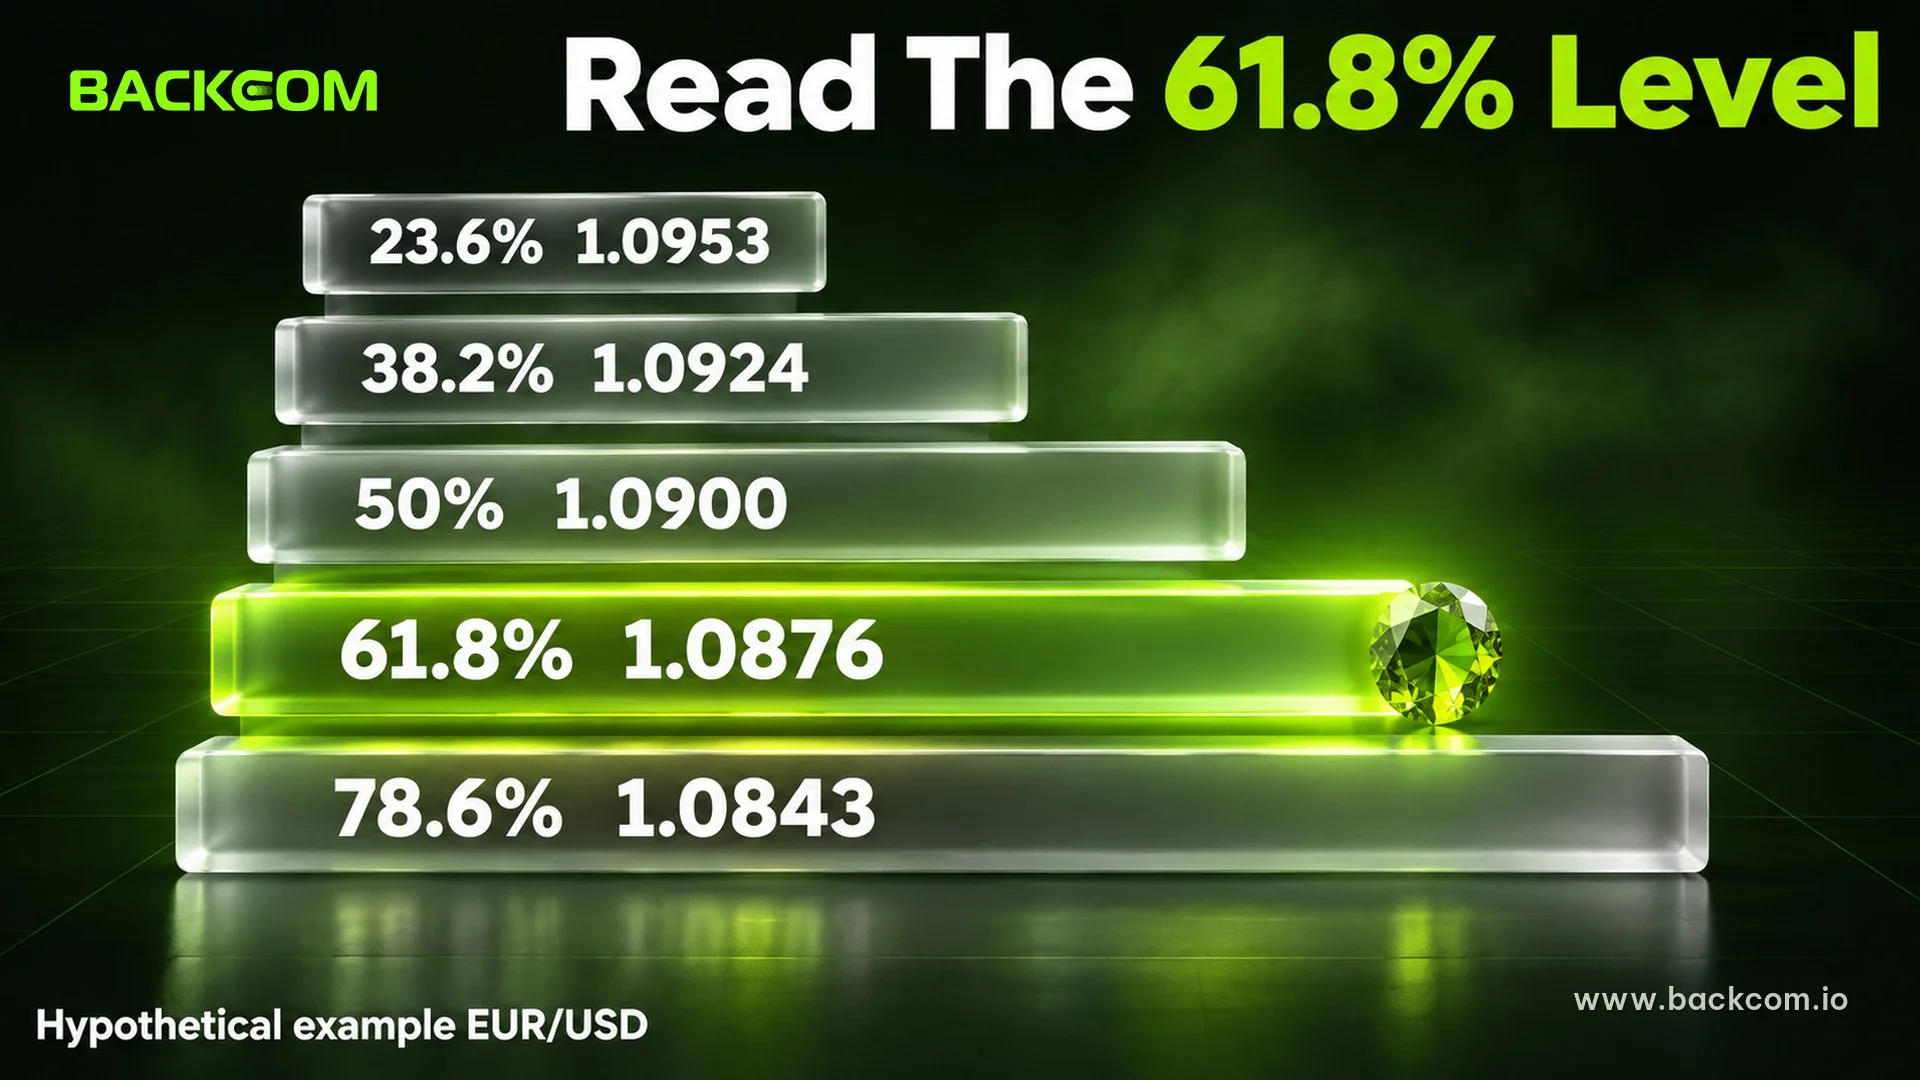
The 61.8% Fibonacci level is a pullback of about the golden ratio (0.618) of the previous move. It is the level many watch most closely, because a pullback this deep can still count as a normal correction within the trend.
Each level has its own typical reading, and it is better to see them as zones than as single lines:
- 23.6%: a shallow pullback, seen when the trend is very strong.
- 38.2%: a moderate pullback. Many traders treat it as the first entry area in a healthy trend.
- 50%: the midpoint of the move. It is not a true Fibonacci ratio but it is widely watched.
- 61.8%: a deep pullback. If price goes through it, traders start to doubt the trend.
- 78.6%: a very deep pullback close to the start of the move. The distance to a stop loss is short, but it also shows that counter-trend sellers or buyers are strong.
Price touching a Fibonacci level does not mean it will bounce. What matters is the reaction there, for example a rejection candle, a close back in the trend direction, or a change in volume. According to Wikipedia, some tests on stock data found that the 38%, 50% and 62% levels were no likelier to appear than other retracement values. That is why this article makes no claim about the win rate of any single level.
A Hypothetical Example On EUR/USD
Suppose EUR/USD rises from a swing low of 1.0800 to a swing high of 1.1000, a move of 200 pips. The formula for a retracement level is:
Retracement price = Swing high − (Ratio × Length of the move)
Applying it to each level gives this table:
| Level | Calculation | Price |
|---|---|---|
| 23.6% | 1.1000 − 0.236 × 0.0200 | 1.0953 |
| 38.2% | 1.1000 − 0.382 × 0.0200 | 1.0924 |
| 50% | 1.1000 − 0.500 × 0.0200 | 1.0900 |
| 61.8% | 1.1000 − 0.618 × 0.0200 | 1.0876 |
| 78.6% | 1.1000 − 0.786 × 0.0200 | 1.0843 |
Example calculation as at 2 November 2026. All prices and pip counts in this article are hypothetical figures for illustration, not real market data.
Prices are rounded to four decimal places. If price pulls back to around 1.0876 and shows a rejection candle, a trader might consider a buy, but the decision still needs other confirmation, not a single number.
Fibonacci Extension: Setting Profit Targets After A Pullback
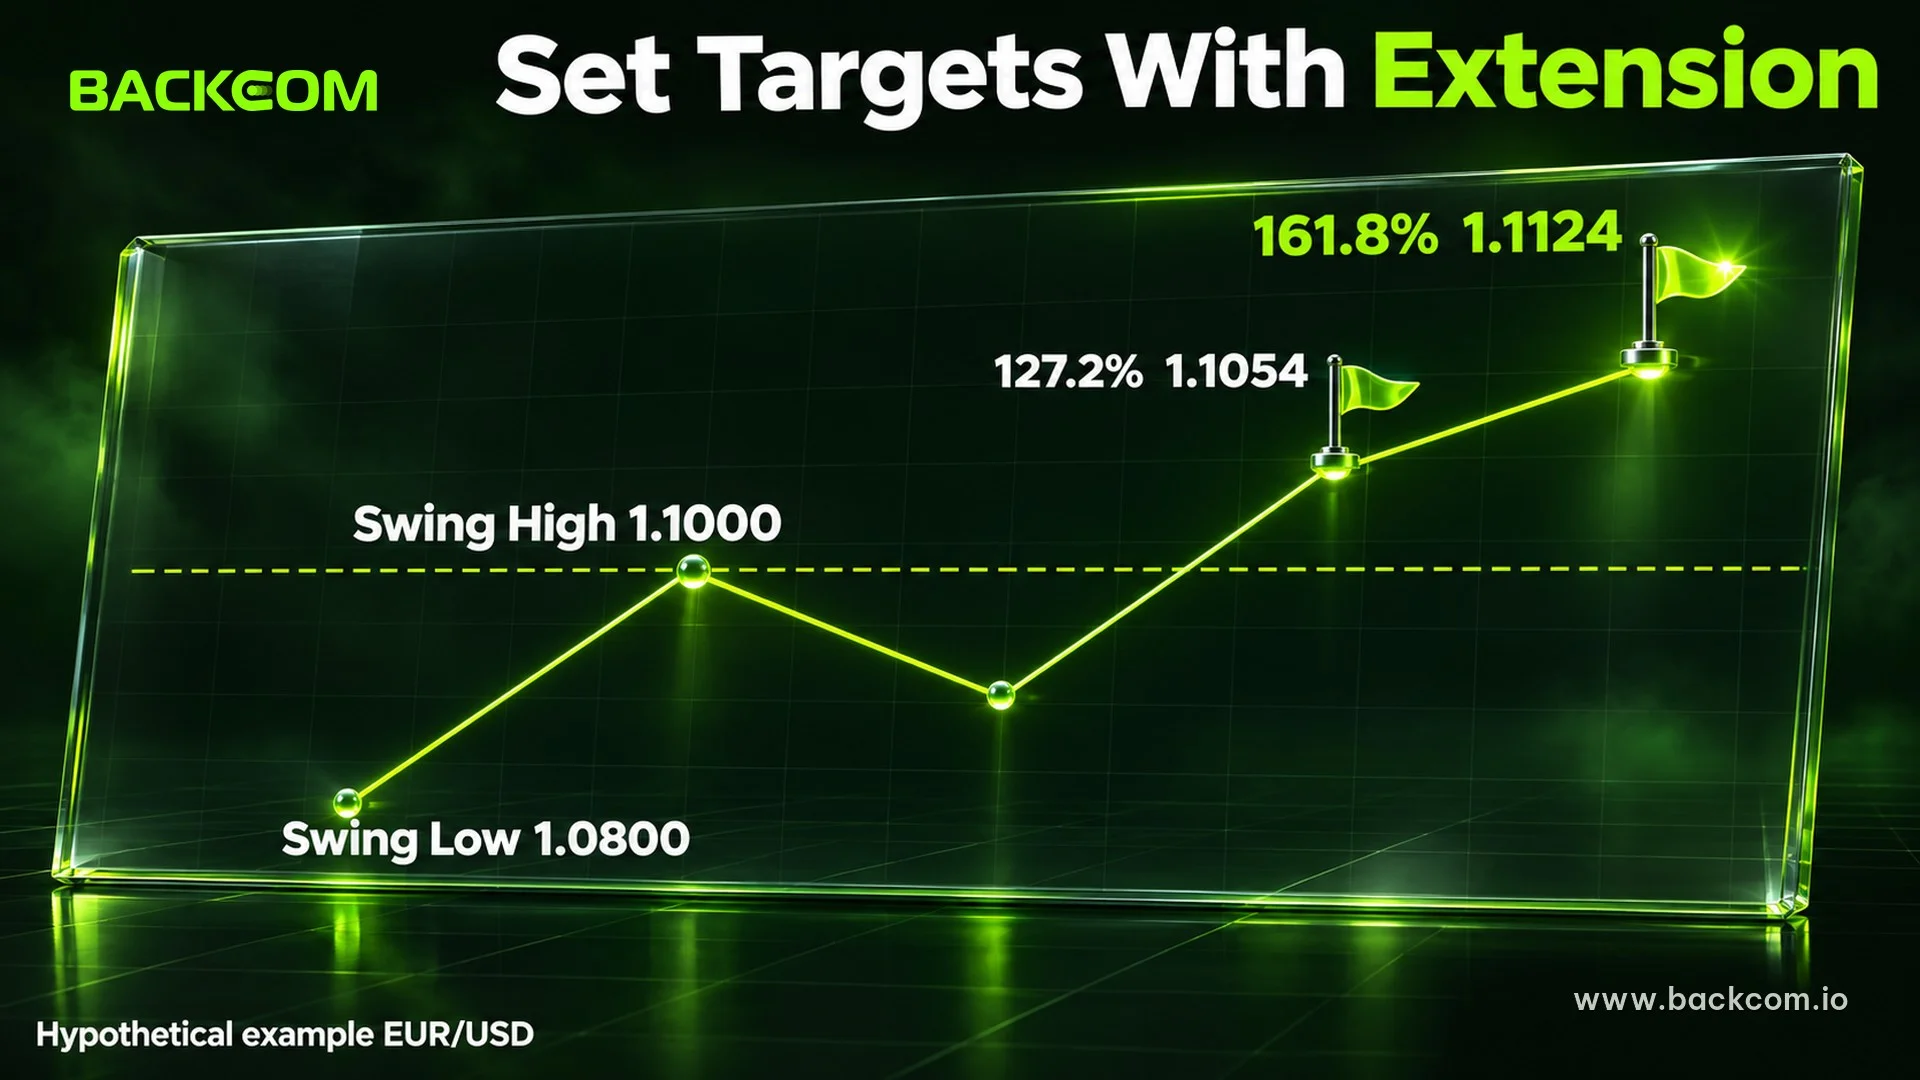
Fibonacci extension measures the zone price may reach after the pullback ends and the trend resumes. Instead of dividing the move between 0% and 100%, it measures beyond the end of the move, so its levels sit outside that range, such as 127.2% and 161.8%.
These levels also come from the sequence. The 161.8% level is the golden ratio itself. The 127.2% level is the square root of 1.618. Traders often use them as zones to take partial or full profit, depending on their plan.
The target formula for an uptrend is:
Target price = Swing low + (Extension ratio × Length of the move)
Continuing the example: the move is 200 pips and the low is 1.0800. The 127.2% target is 1.0800 + 1.272 × 0.0200 = 1.1054. The 161.8% target is 1.0800 + 1.618 × 0.0200 = 1.1124.
If you use the retracement tool you already drew (low at 100%, high at 0%), these two targets appear as negative levels, −27.2% and −61.8%, above the high. So calculate them with the formula above or use the platform's separate extension tool, instead of looking for 127.2% below the low.
Some platforms measure extension from three points instead of two, using the two ends of the move plus the end of the pullback. Whichever you use, check whether the target sits near a major resistance zone, because price may stall there first.
Combining Fibonacci With Stop Loss And Position Size
A Fibonacci level cannot answer where to put the stop loss. The invalidation point of the trade idea decides that. For a buy at a pullback zone, the idea fails when price breaks the swing low, so the stop usually goes below that low plus a small buffer. Our article on how to set a stop loss by invalidation point and ATR covers the method in detail.
Here is a complete hypothetical trade plan using the example above:
- Buy entry at 1.0876: price pulls back to the 61.8% level and prints a rejection candle.
- Stop loss at 1.0795: below the 1.0800 swing low with a 5-pip buffer. The stop distance is 81 pips.
- Take profit at 1.1054: the 127.2% extension. The target distance is 178 pips.
- Reward-to-risk ratio: 178 ÷ 81 ≈ 2.2.
The position size formula is:
Lots = Amount at risk ÷ (Stop distance in pips × Value of 1 pip per lot)
For a hypothetical 2,000 USD account risking 1%, that is 20 USD. One pip of one EUR/USD lot is worth about 10 USD, so lots = 20 ÷ (81 × 10) = 0.0247, rounded down to 0.02 lots. The maximum loss is about 16 USD if the stop fills at the set price.
These numbers only show the arithmetic and are not a recommendation on capital or risk level. For converting pips into money, see what a pip is in forex. Lot sizing is covered in forex money management and the 1% rule, and you can test combinations with the position size calculator.
Limits Of Fibonacci And How To Combine It With Other Tools
Fibonacci has two big weaknesses that you should accept from the start. First, the result depends on which swing you choose, and two traders can anchor the tool at different points on the same chart. Second, there are so many levels that price is almost always near one of them, which creates the illusion that the tool is "right".
Several ways traders reduce these weaknesses are:
- Trade only when several factors point to one zone: for example, the 61.8% level overlapping an old support area.
- Wait for a confirmation candle: instead of placing an order at the level, wait for a rejection or a close back in your direction.
- Add an indicator: momentum tools such as RSI can flag overbought or oversold conditions inside the pullback zone.
- Use the right timeframe: a large swing on H4 or D1 is usually more reliable than a small one on M5.
- Record results: a trading journal shows which levels actually work for your style.
Finally, test Fibonacci on a demo account and on past data before risking real capital. If you trade often, also compare spreads and commissions across brokers. Backcom.io is an independent introducing broker (IB/affiliate) of the brokers it lists, and rebates are paid from the commission the broker pays Backcom.io (see the risk disclaimer). Current terms and rebate levels are on the partner brokers page. A rebate does not make a trade right and cannot offset a losing trade.
Frequently Asked Questions (FAQ) About Fibonacci
Is Fibonacci Accurate?
No tool is perfectly accurate, and Fibonacci is no exception. At least one academic study could not confirm the statistical significance of the retracement levels. You should treat each level as a reference zone, combine it with price structure and risk management, and not expect price to turn at an exact number.
Which Fibonacci Level Is The Most Important?
No level is the most important in every case. Many traders watch the 61.8% level and 38.2% most, while 50% is watched out of habit. What suits you depends on your trading style and market, so test it on data from the pair you actually trade.
Which Timeframe Is Best For Fibonacci Retracement?
Fibonacci works on any timeframe, but swings on larger frames such as H4 and D1 usually carry less noise. When you draw Fibonacci retracement on small frames, many levels overlap with noise. A common approach is to define the swing on a larger frame and look for entries on a smaller one.
How Is Fibonacci Extension Different From Retracement?
Retracement measures how far price may pull back inside the previous move, while Fibonacci extension measures where it may travel beyond that move. Traders usually use retracement to find entries and extension to find exits. Both use the same swing, so draw it carefully.
Conclusion: What Fibonacci Is And How To Use It For A Clear Trade Plan
Understanding Fibonacci retracement forex analysis means grasping three things: the 38.2% and 61.8% ratios come from dividing numbers in the sequence, how you draw the tool decides how useful the levels are, and every level is only a reference zone that needs confirmation from price structure. Traders should look at the swing, the invalidation point and the reward-to-risk ratio together instead of staring at one number on the chart.
A good next step is to pick one currency pair, draw Fibonacci on a few completed swings, and note how price reacted at each level. When you are ready to go further, read our guide on forex money management and the 1% rule to build a risk framework for the whole account.
Disclaimer: This content is compiled by Backcom.io for information and reference only and is not investment advice or a trading recommendation. Trading forex and CFDs carries a high level of risk and you can lose all of your capital. The numerical examples are hypothetical, Fibonacci does not guarantee any reaction at any level, and you need to check conditions yourself before placing a trade.
Was this article helpful?
Join The Backcom.io Community
Get the latest on trading rebates, trading tips, and broker deals — and connect with thousands of traders worldwide.

Backcom App
Track Your Rebates Every Day
Every rebate is visible by broker and by day. Manage your wallet and withdrawals in one place.
Open Backcom App