What Is Expectancy In Trading? Formula, R-Multiple And How To Calculate It


A system that wins 65% of its trades can still shrink an account month after month, while one that wins only 35% grows steadily. What is expectancy in trading is the question that explains this: it tells you how much a trade earns or loses on average once you repeat it many times.
The number is also called mathematical expectation, and it is built from three inputs: win rate, average win and average loss. Traders who look only at win rate often misjudge their own strategy, because win rate is just half of the calculation.
In this article, Backcom.io explains the expectancy formula, works through examples with real numbers, shows how to calculate it from a trade journal and covers when the result can be trusted.
What Is Expectancy In Trading? What Mathematical Expectation Tells You
Expectancy is the average profit or loss a single trade of a trading system produces over a large number of trades, measured in money or in multiples of risk (R). Positive expectancy means each trade makes money over the long run, and negative expectancy means the more you trade, the more you lose.
The idea is a direct application of expected value in probability: the average of all possible outcomes, each weighted by its probability. You can read the general definition on the Wikipedia page for expected value.
The key point is that expectancy describes the system, not a single trade. Any one trade can win or lose whether expectancy is positive or negative.
Three inputs make up expectancy:
- Win rate: the percentage of closed trades that make a profit.
- Average win: total profit divided by the number of winning trades.
- Average loss: total loss divided by the number of losing trades, taken as a positive number.
With one of the three missing, the calculation is incomplete. That is why quoting only a win rate, or only a risk reward ratio, says little about whether a strategy makes money.
Trading Expectancy Formula From Win Rate And Risk Reward
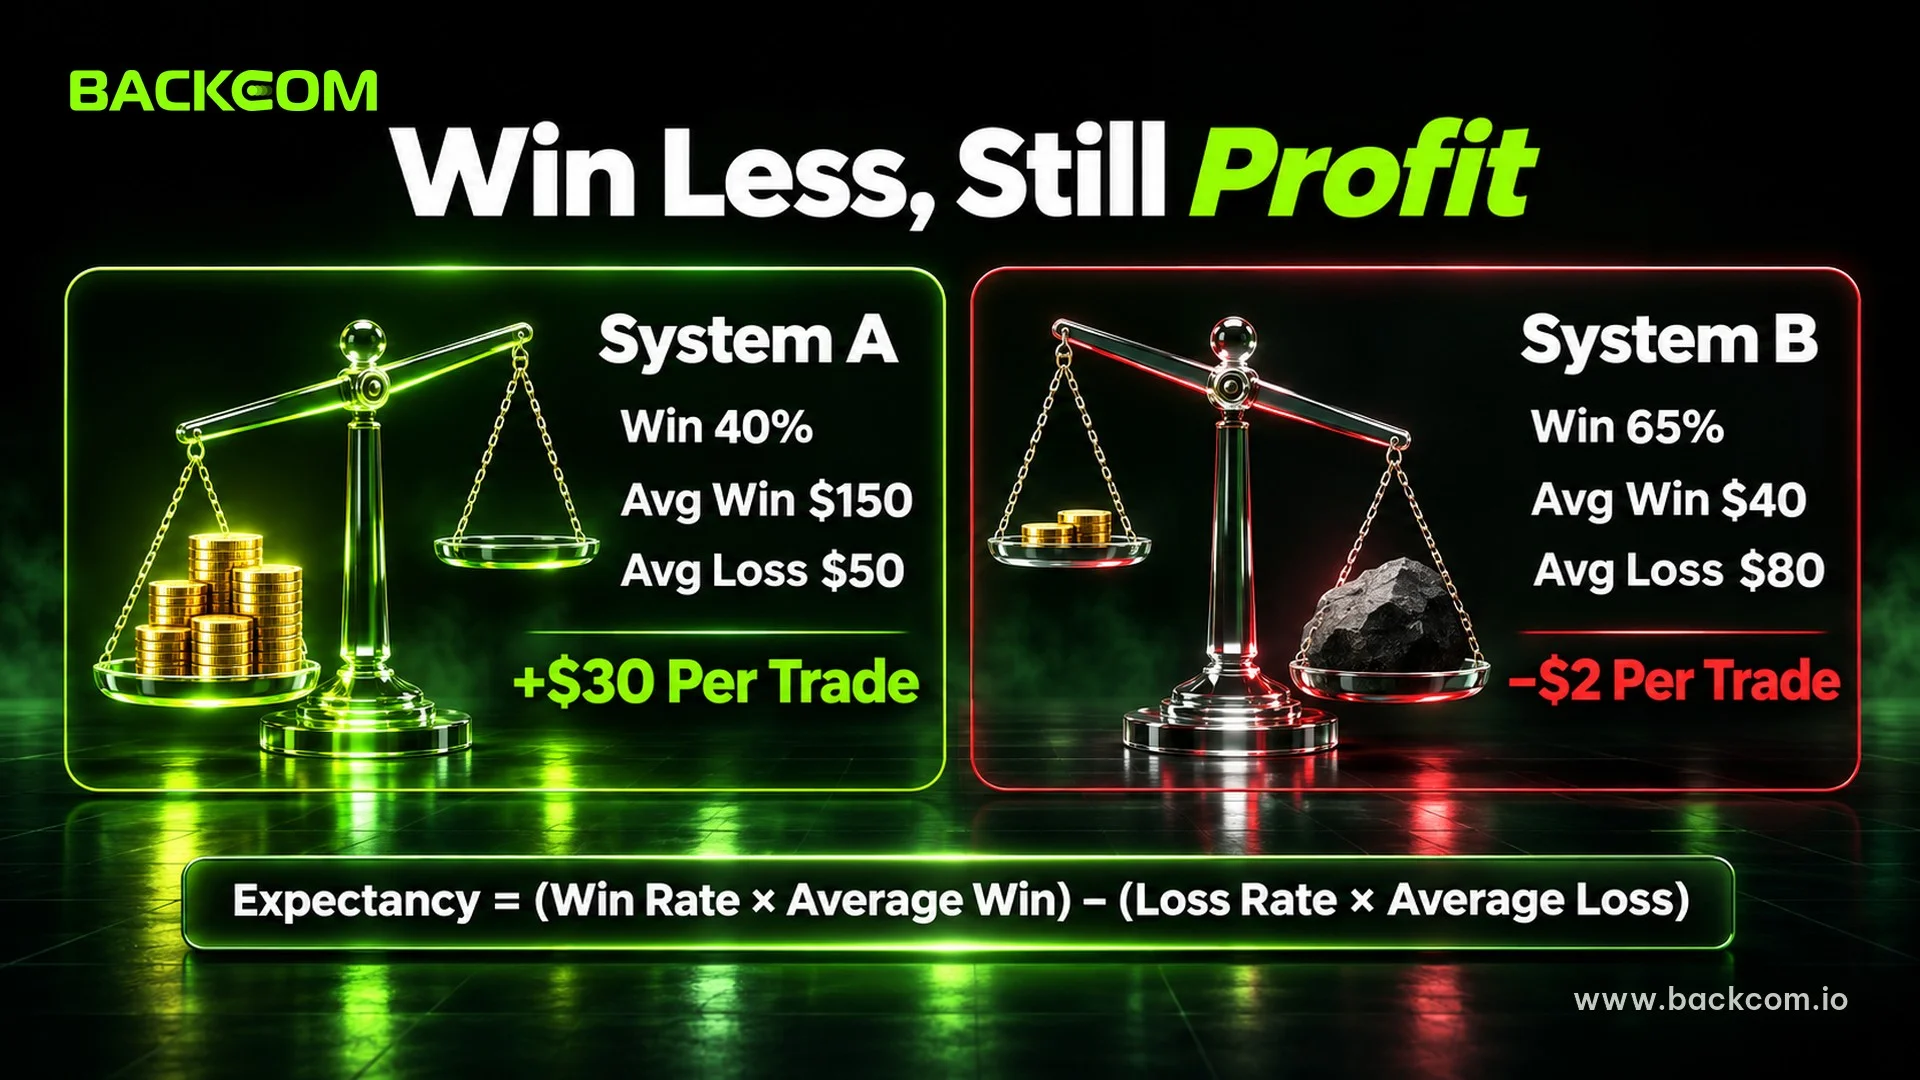
The trading expectancy formula for an average trade is win rate times average win, minus loss rate times average loss, where loss rate equals 1 minus win rate.
Expectancy = (Win Rate × Average Win) − (Loss Rate × Average Loss)
System A wins 40% of trades, with an average win of $150 and an average loss of $50. The calculation is 0.40 × 150 = 60 and 0.60 × 50 = 30, so expectancy is 60 − 30 = +$30 per trade. Even though the trader loses 60% of the time, the system makes money because each winner is three times the size of each loser.
System B is the opposite: a 65% win rate, an average win of $40 and an average loss of $80. Here 0.65 × 40 = 26 and 0.35 × 80 = 28, so expectancy is −$2 per trade. The win rate is higher, yet the trader still loses money, because each loser is twice the size of each winner.
| Input | System A | System B |
|---|---|---|
| Win rate | 40% | 65% |
| Average win | $150 | $40 |
| Average loss | $50 | $80 |
| Average win ÷ average loss | 3.0 | 0.5 |
| Expectancy per trade | +$30 | −$2 |
These figures only illustrate the arithmetic and are not results of any specific strategy.
If you express every trade as a multiple of 1R of risk, the average loss is 1R and the average win equals the risk reward ratio (RR), so the formula shortens to:
Expectancy (R) = Win Rate × RR − Loss Rate
For system A this gives 0.40 × 3 − 0.60 = +0.6R. Each trade is expected to return 0.6 times the amount risked, which with R at $50 is the same $30 as above. The guide to the risk reward ratio and how many trades a 1:2 ratio must win covers breakeven in depth, and this article combines it with win rate to produce a single number.
Calculate Expectancy From A Trade Journal Using 30 Sample Trades
To calculate expectancy from a trade journal, you need the real result of every closed trade, not an estimate from memory. The 12-column template in the trading journal guide already has a result column, and you only need to add an R column if you want to work in R later.
The process has five steps:
- Filter trades from one strategy: do not mix two methods, because each has its own expectancy.
- Record the net result of each trade: after spread, commission and swap.
- Split into two groups: winners and losers, with breakeven trades placed in the losing group at a value of zero.
- Work out the three inputs: win rate, average win, average loss.
- Apply the formula and note the date: so you can compare with the next period.
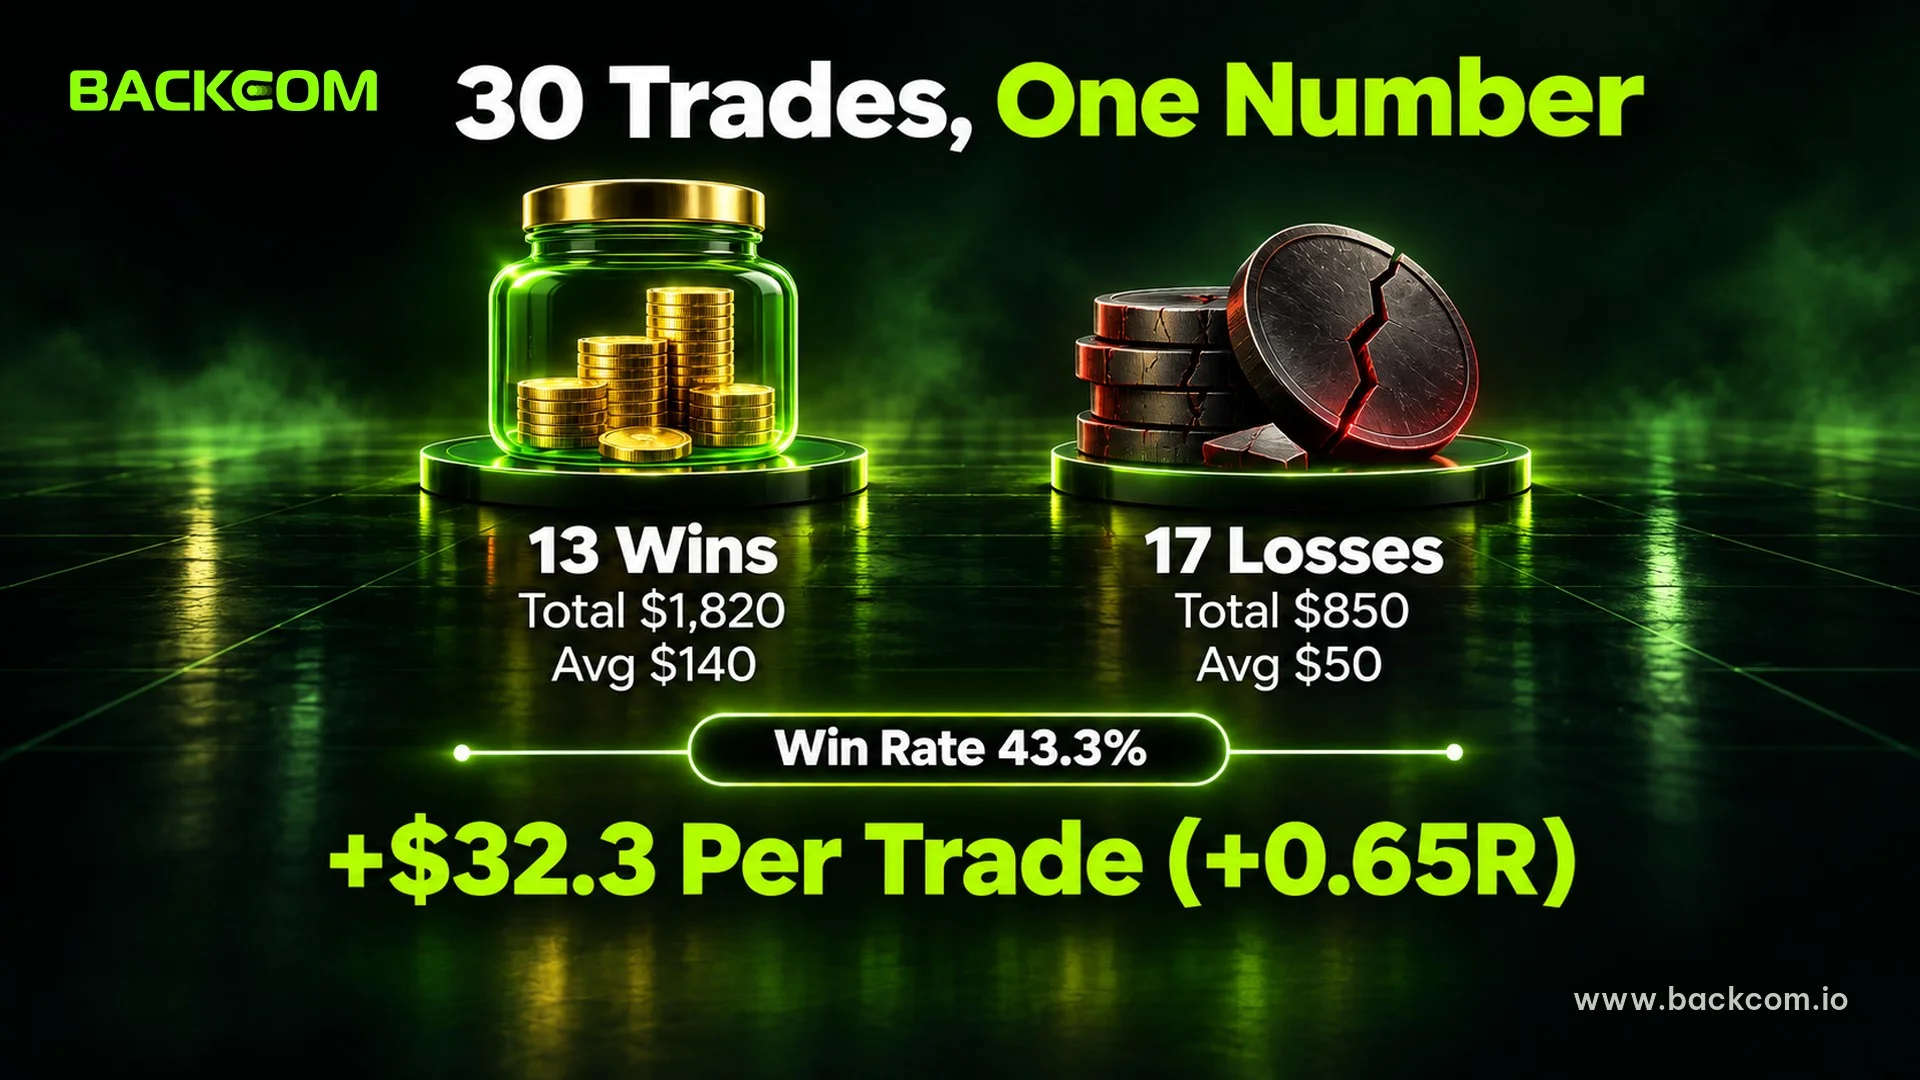
Suppose the last 30 trades of a strategy include 13 winners and 17 losers. The winning group made $1,820 in total and the losing group lost $850 in total.
| Metric | Calculation | Result |
|---|---|---|
| Win rate | 13 ÷ 30 | 43.3% |
| Average win | 1,820 ÷ 13 | $140 |
| Average loss | 850 ÷ 17 | $50 |
| Expectancy | (0.433 × 140) − (0.567 × 50) | +$32.3 per trade |
These figures only illustrate the arithmetic, and a real journal will give different results.
There is a faster cross-check: expectancy equals total profit minus total loss, divided by the number of trades, which is (1,820 − 850) ÷ 30 = $32.3, matching the table. If each trade is recorded in pips, the guide to how to calculate profit in forex by pips and lots helps you convert them to money before they go into the journal.
R-Multiple Expectancy: Why Measuring In R Makes Comparison Easier
An R-multiple is the result of a trade divided by the money risked on that same trade, meaning the distance to the stop loss converted to money. A trade that risks $50 and closes with a $150 profit is +3R, and a trade that closes at its stop loss is −1R. The Van Tharp Institute defines expectancy as the mean R of an R-multiple distribution produced by a trading system.
Measuring in R has two advantages:
- It compares different periods and different instruments: whether the account grows from $1,000 to $5,000, or you compare a gold trade with a EURUSD trade, everything is expressed as a multiple of risk.
- It ties directly to money management: a trader who risks 1% of the account per trade and has an expectancy of 0.65R can expect roughly 0.65% of the account per trade, before variance.
Expectancy (R) = Average of the R-multiples of all trades
In the 30-trade sample above, each winner averages +2.8R (140 ÷ 50) and each loser is −1R. The result is (13 × 2.8 − 17 × 1) ÷ 30 = 19.4 ÷ 30 = +0.65R, which equals $32.3 when R is $50.
This only works when R is stable from trade to trade. The 1% risk rule and a position size calculator keep R fixed, whereas if R swings between 0.5% and 3% of the account the calculated expectancy gets distorted.
Expectancy Vs Win Rate: What Win Rate Is Enough, And An Expectancy Table By Win Rate And R:R
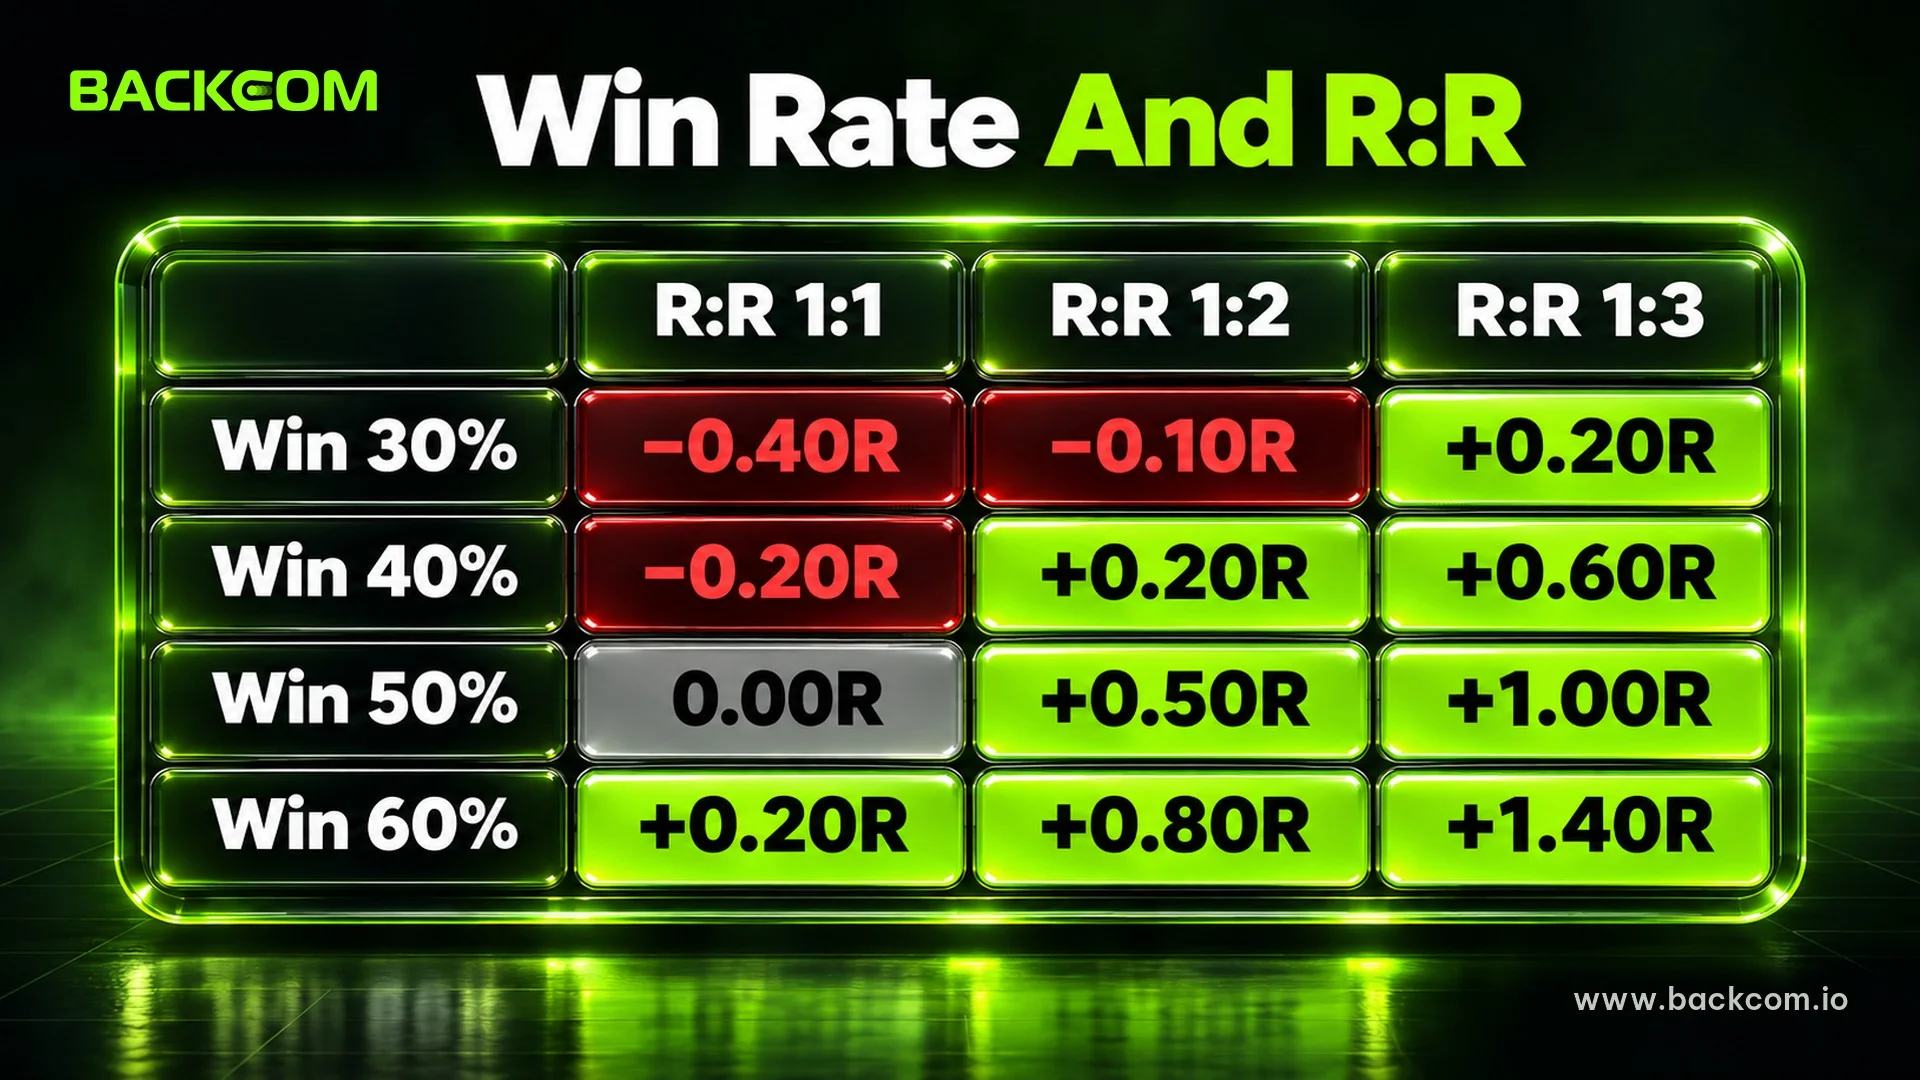
The breakeven win rate is the win rate at which expectancy equals zero, and it depends only on RR. At RR 1:1 you need to win 50%, at 1:2 you need 33.3%, and at 1:3 you need 25%.
Breakeven Win Rate = 1 ÷ (1 + RR)
The table below shows expectancy in R per trade for common pairs of win rate and RR.
| Win rate | RR 1:1 | RR 1:2 | RR 1:3 |
|---|---|---|---|
| 30% | −0.40R | −0.10R | +0.20R |
| 40% | −0.20R | +0.20R | +0.60R |
| 50% | 0.00R | +0.50R | +1.00R |
| 60% | +0.20R | +0.80R | +1.40R |
Calculated as win rate × RR − loss rate, before trading costs, for illustration of the arithmetic only.
How to read the table:
- RR 1:1 column: positive only when the win rate is above 50%.
- 30% row: positive only at RR 1:3, because the breakeven for RR 1:2 is 33.3%.
- 40% row: moves from −0.20R to +0.20R when RR rises from 1:1 to 1:2.
- 50% row: breakeven at RR 1:1 and positive in the other two columns.
One consequence is that RR and win rate are not independent. Traders who move take profit further away to raise RR usually see price reach the target less often, so the win rate falls. That is why expectancy should be re-measured on real data after every change to how you take profit.
How Trading Costs Eat Into Expectancy
Spread, commission and swap are fixed deductions on every trade, so they pull expectancy down directly, whether the trade wins or loses.
Expectancy After Costs = Expectancy Before Costs − Net Cost Per Trade
Suppose a scalping system has an expectancy of +$10 per trade before costs. Depending on average cost, the result changes like this:
- $4 cost per trade: expectancy drops to +$6, and costs eat 40% of the edge.
- $7 cost per trade: expectancy drops to +$3.
- $10 cost per trade: expectancy is zero and the system has no edge left.
The thinner the edge, the more costs matter. That is why systems that take many short trades are more sensitive to costs than systems that hold longer, and why the guide to overtrading in forex counts fees when it sets a daily trade limit.
A rebate programme through an IB partner returns to the trader part of the commission the broker pays the partner per lot, which lowers the net cost per trade. Assuming a rebate cuts the cost from $4 to $3, the expectancy in the example rises from $6 to $7 per trade. A rebate only reduces cost: it does not turn a negative-expectancy system positive, and it is not a reason to open more trades.
Actual rebate levels for each broker are on the forex broker comparison page. Backcom.io is an independent introducing broker (IB/affiliate) of the brokers listed; rebates are paid from the commission the broker pays Backcom.io — see the risk disclaimer.
How Many Trades Before Expectancy Is Reliable? Small-Sample Error
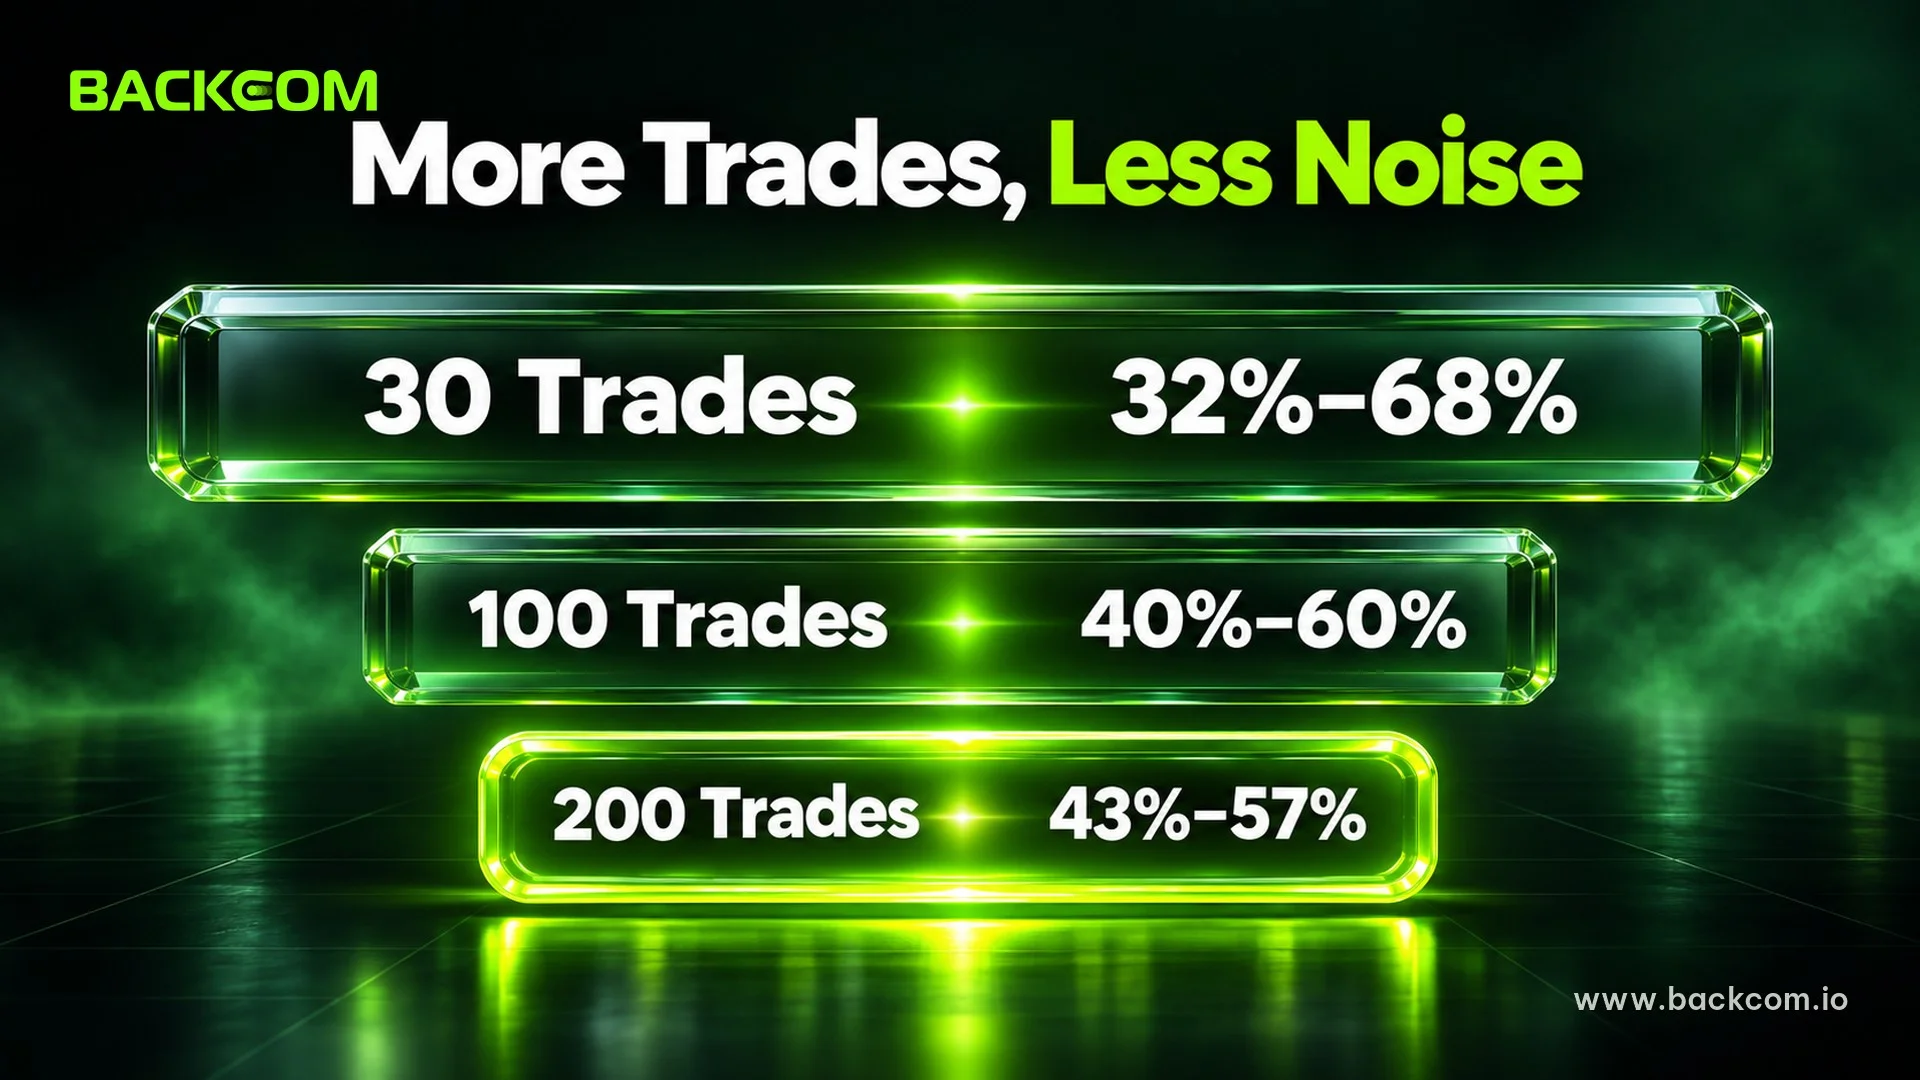
Expectancy is measured from a sample, so it always carries error, and the smaller the sample the larger the error. The standard error of a win rate is the square root of p × (1 − p) divided by n, where p is the win rate and n is the number of trades.
Standard Error = √(p × (1 − p) ÷ n)
With p at 50%, the 95% confidence range is roughly ±1.96 standard errors, and the table shows how it narrows as trades accumulate.
| Trades measured | Standard error | Range the true win rate could fall in |
|---|---|---|
| 30 trades | 9.1 percentage points | 32% – 68% |
| 100 trades | 5.0 percentage points | 40% – 60% |
| 200 trades | 3.5 percentage points | 43% – 57% |
Normal-distribution approximation, only to show how large the error can be.
The table only measures win rate, while expectancy also depends on how widely wins and losses vary, so the +$32.3 from the 30-trade sample is only a starting point. To trust it more, you need several hundred trades, or a backtest on a long enough data set followed by a check on a demo account or small capital.
Positive expectancy also does not remove losing streaks. With a 40% win rate, the probability that 5 trades in a row all lose is 0.6 to the power of 5, about 7.8%, so after a few hundred trades meeting such a streak is normal. The depth of a losing streak is measured in the guide to drawdown in trading.
4 Common Mistakes When Calculating Expectancy
1. Mixing several strategies in one calculation
Trend trades and reversal trades have very different win rates and RR. Mixing them gives a number that describes neither system, so each setup needs its own expectancy line.
2. Dropping trades that broke the plan
Removing trades that broke the plan makes expectancy look better than it is. A better approach is to calculate two numbers, one for plan-compliant trades and one for all trades, because the gap between them is the cost of lacking discipline.
3. Letting one outlier pull the whole average
A single +20R trade in a sample of 40 can make expectancy positive even if the other 39 trades made no profit. Calculate expectancy again after removing the largest trade, and if the result drops close to zero, the edge is not solid.
4. Changing risk between trades
When R is 0.5% on one trade and 3% on the next, the average R-multiple no longer reflects real money. Place stops at the invalidation point of the setup and size lots from a fixed risk.
Frequently Asked Questions (FAQ) About Trading Expectancy
What Expectancy Counts As Good?
There is no standard threshold, but the minimum condition is expectancy that is positive after costs on a large enough sample. The thinner the margin, the more easily costs and sampling error can turn it negative.
Is A Low Win Rate A Problem?
Not if RR is large enough. The table above shows a 30% win rate with RR 1:3 still has an expectancy of +0.20R. The price is long losing streaks, so you need to be comfortable with that psychological side before choosing this kind of system.
Should Expectancy Be Calculated In Dollars Or In R?
Use R to compare across periods and instruments, and use dollars when you need to estimate money over a period. The two give the same conclusion when risk per trade is stable.
How Many Trades Do You Need To Calculate Expectancy?
There is no fixed number, but 30 trades give a win-rate error of about ±18 percentage points at 95% confidence, while 100 trades narrow it to about ±10 points. More is better, as long as they come from the same strategy.
Does Expectancy Change With The Market?
Yes. Trend-following systems usually weaken when the market moves sideways, so recalculate periodically, for example every 50 new trades, and note the date.
Conclusion: Use Expectancy To Judge A System, Not Just Win Rate
Expectancy is useful when you look at three things together: win rate, average win and loss, and trading costs. A positive number on a small sample is not proof, because sampling error can be larger than the edge being measured.
The immediate steps are to take the last 30 trades of one strategy, work out the three inputs, apply the formula and record the date. Then keep journaling up to a few hundred trades before raising risk. For the groundwork on lot sizing and R, start with the guide to forex money management and the 1% rule.
Disclaimer: This content is compiled by Backcom.io for information only and is not investment advice, a trading recommendation or financial advice. Trading forex and CFDs carries a high level of risk and you can lose all of your capital, and the numerical examples in this article only illustrate the arithmetic.
Was this article helpful?
Join The Backcom.io Community
Get the latest on trading rebates, trading tips, and broker deals — and connect with thousands of traders worldwide.

Backcom App
Track Your Rebates Every Day
Every rebate is visible by broker and by day. Manage your wallet and withdrawals in one place.
Open Backcom App