Risk Reward Ratio Forex: What It Is And How Many Trades A 1:2 Ratio Must Win


Many traders set a stop loss and a take profit before entering, yet never check whether those two prices give them an edge. The answer sits in the risk reward ratio: a comparison of the maximum loss and the profit target on the same trade.
On its own the number means little. It only works next to the breakeven win rate, the lowest share of winning trades that keeps an account from losing money. A 1:2 risk reward ratio sounds attractive, but you still need to know how many of 30 trades must win, and how much the spread pushes that figure up.
In this article, Backcom.io explains how to calculate the risk reward ratio step by step, gives the breakeven formula with a table from 1:1 to 1:5, runs a 30-trade example and points out the mistakes that make the ratio on paper differ from the ratio in practice.
What Is Risk Reward Ratio Forex? How To Read It On A Single Trade
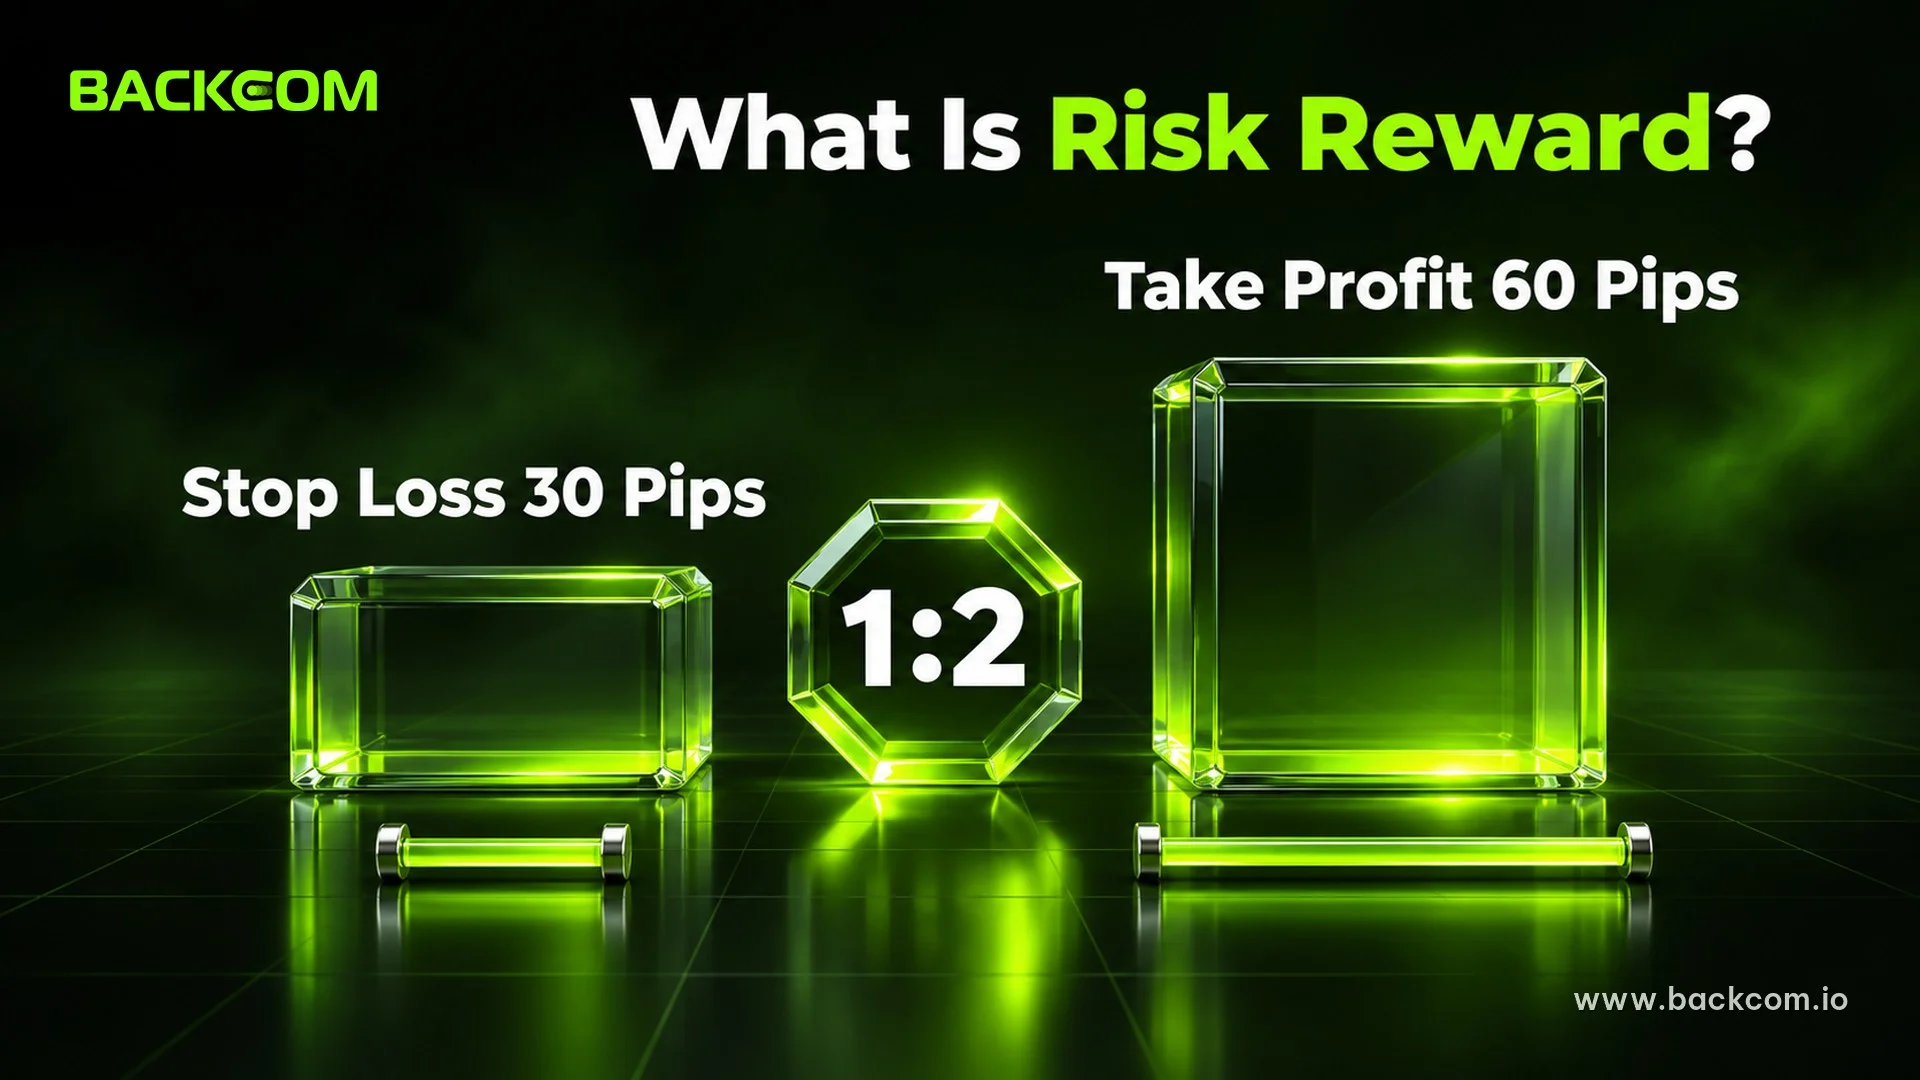
The risk reward ratio forex traders use compares the amount a trader accepts to lose if price hits the stop loss (risk) with the amount expected if price hits the take profit (reward). A ratio of 1:2 means risking 1 part to target 2 parts, so the profit target is twice the maximum loss.
The first thing people confuse is the order of the numbers:
- Risk:reward puts risk first, so 1:2 is better than 1:1. This is the format used in this article.
- Reward:risk puts the profit first, so 2:1 is the profit target of twice the loss.
The same trade can be written as 1:2 or 2:1, so check which direction a source uses before comparing figures.
An example makes it concrete. A trader plans to buy EURUSD at 1.0850, with a stop loss at 1.0820 and a take profit at 1.0910:
- Distance to the stop loss: 30 pips.
- Distance to the take profit: 60 pips.
- Risk reward ratio: 30 : 60 = 1:2.
At 0.10 lot, one pip is worth about USD 1, so the trade risks USD 30 to target USD 60. The pip-to-money conversion is covered in what a pip is in forex.
The ratio only describes the plan for a trade. It does not tell you how likely price is to reach either level. To know whether the plan has an edge, you need to pair it with the win rate in the sections below.
How To Calculate Risk Reward Ratio Step By Step, Including Spread
Calculating the risk reward ratio takes four steps, and the fourth is the one beginners usually skip.
- Set the entry price and the stop loss: place the stop where your idea is proven wrong, not where you can afford to lose a set amount. The guide on how to set a stop loss using invalidation and ATR shows how to pick that point.
- Set the take profit target: choose a price zone with a technical reason, such as the nearest high or a resistance level, instead of a number picked to make the ratio look good.
- Measure both distances: entry minus stop gives the risk, and target minus entry gives the reward (reverse the signs for a sell).
- Subtract costs from both sides: the spread makes the real entry price worse, which increases the risk and reduces the reward.
The general formula:
Risk reward ratio = Distance to take profit ÷ Distance to stop loss
Back to the EURUSD example. Assume a 1.2-pip spread and that 1.0850 is the bid price on the chart. A buy order fills at the ask, 1.2 pips higher, while the stop loss and take profit of a buy trade trigger on the bid. The real distances are:
| Item | Plan on the chart | After the 1.2-pip spread |
|---|---|---|
| Risk (to the stop loss) | 30 pips | 31.2 pips |
| Reward (to the take profit) | 60 pips | 58.8 pips |
| Risk reward ratio | 1:2 | 1:1.88 |
Illustrative calculation as at 15 November 2026. The 1.2-pip spread is an assumption for comparison; real spreads vary by broker, account type and time of day.
The gap looks small but grows quickly with short stops: on a 10-pip stop, the same 1.2-pip spread already takes more than 10% of the risk distance. The factors that move spreads are explained in what the forex spread is.
A ratio in pips is not yet a dollar amount. Size the position from the risk you chose, usually 1% of the account, with the position size calculator.
Breakeven Win Rate: Formula And Table By Risk Reward Ratio
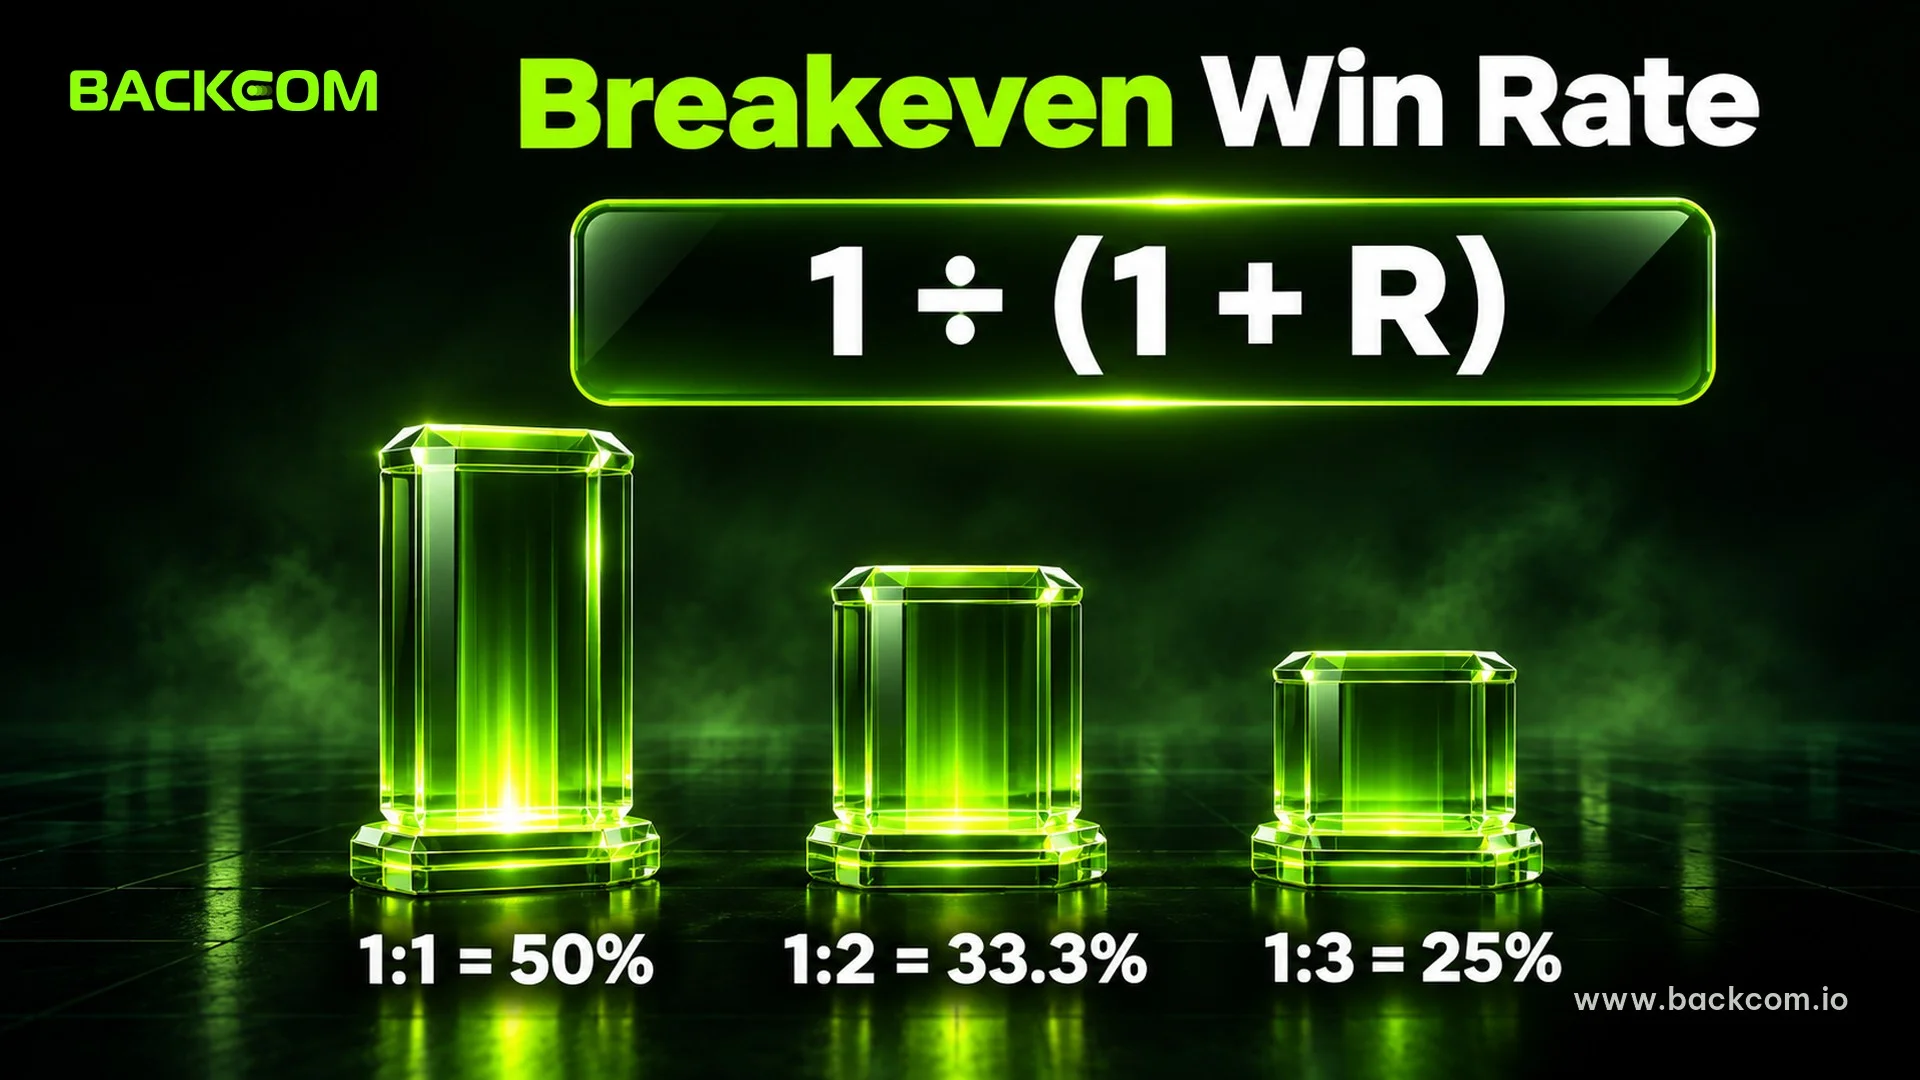
The breakeven win rate is the lowest share of winning trades at which wins and losses cancel out, before costs. Let R be the reward part of a 1:R ratio. The formula is:
Breakeven win rate = 1 ÷ (1 + R)
Each win earns R units and each loss costs 1 unit, so the account breaks even when wins multiplied by R equal the number of losses. The same formula appears in the guide to choosing a reward-to-risk ratio published on Babypips on 26 March 2026, where a 3:1 reward-to-risk setup needs about 25% to break even; by the same formula, 2:1 needs about 33%.
Read it directly: Babypips guide to choosing a reward-to-risk ratio.
Applying the formula to the common ratios:
| Risk reward ratio | R value | Breakeven win rate |
|---|---|---|
| 1:0.5 | 0.5 | 66.7% |
| 1:1 | 1 | 50% |
| 1:1.5 | 1.5 | 40% |
| 1:2 | 2 | 33.3% |
| 1:3 | 3 | 25% |
| 1:4 | 4 | 20% |
| 1:5 | 5 | 16.7% |
Formula and figures calculated as at 15 November 2026. This is pure arithmetic and excludes spread, commission and swap.
The further the ratio leans toward reward, the more trades you can afford to lose. A trade with less reward than risk, such as 1:0.5, needs a win rate so high that very few strategies sustain it over time.
How Many Of 30 Trades Must Win With A Risk Reward Ratio 1:2?
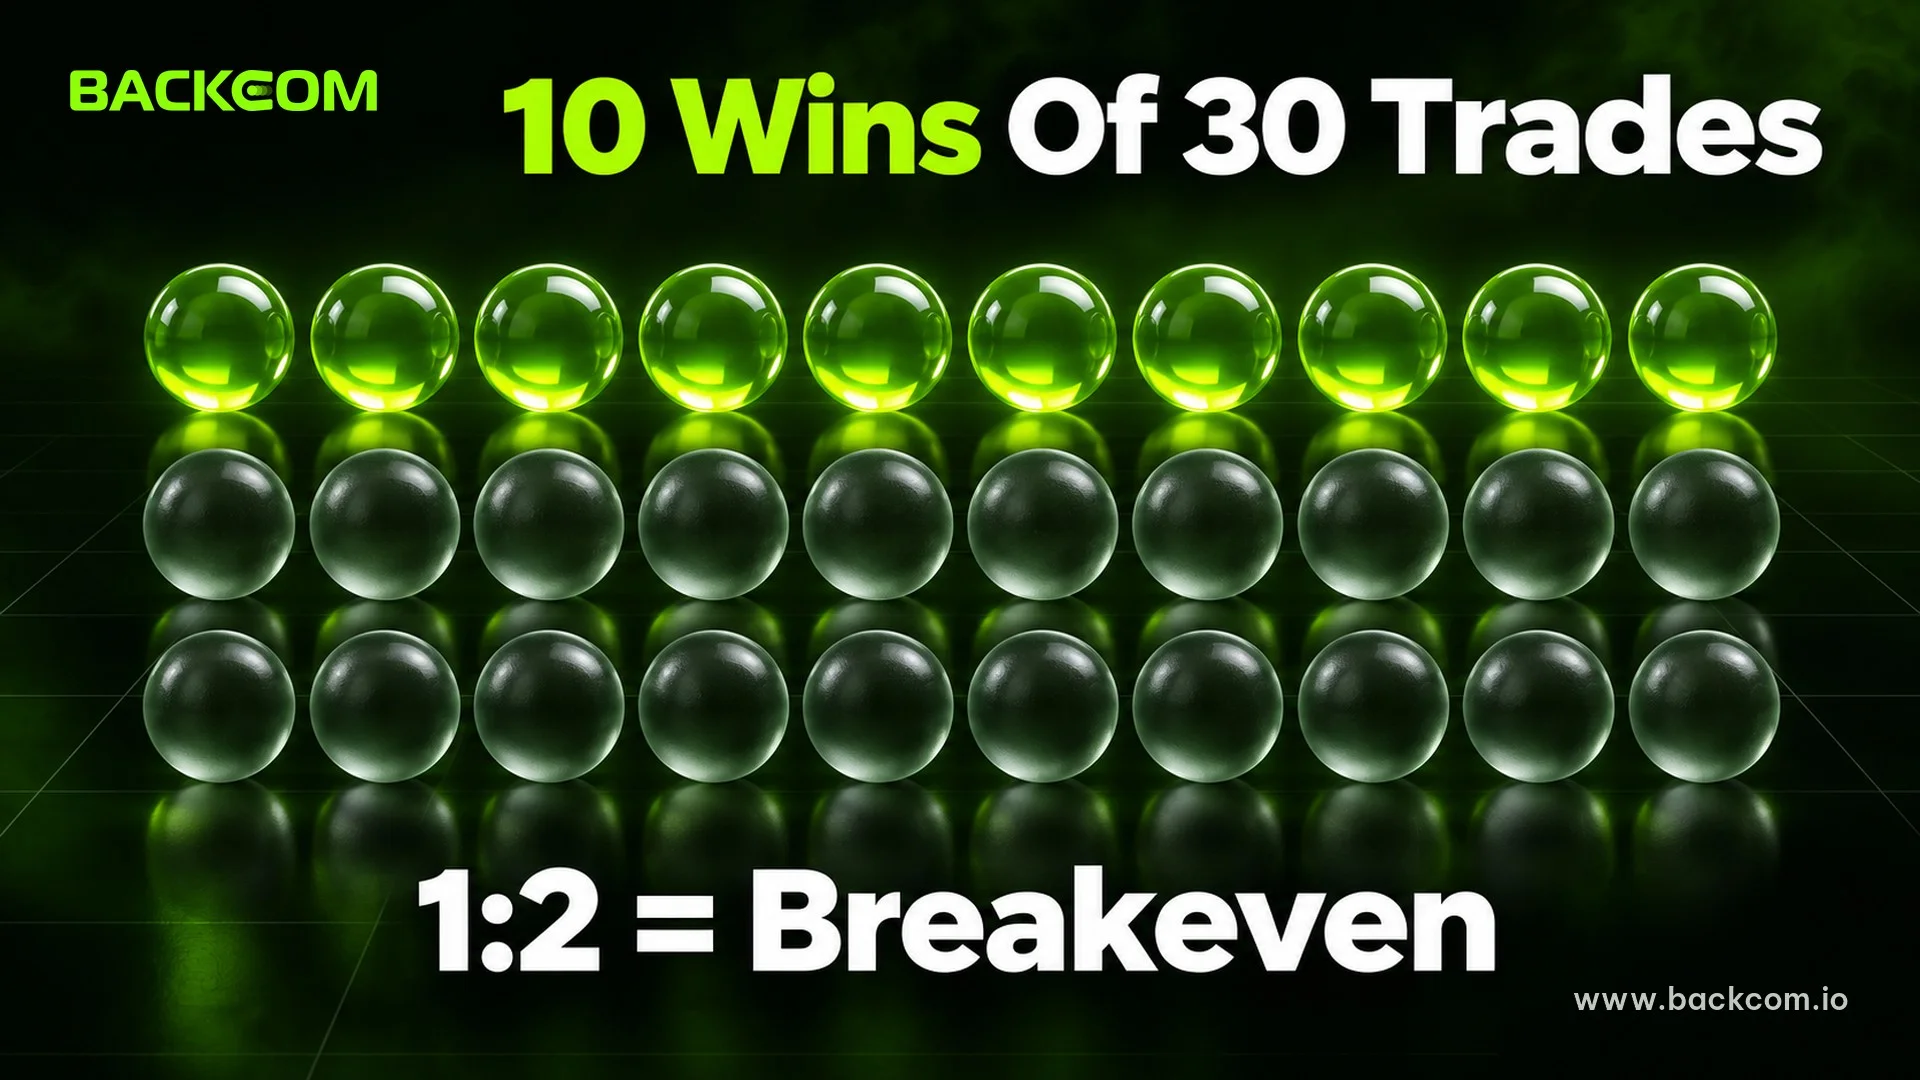
A percentage table is easy to misread as "winning one in three is fine". A 30-trade example shows how a 1:2 risk reward ratio really behaves.
Assume a USD 10,000 account risking 1% per trade: USD 100 on a losing trade and USD 200 on a winning one. The result after 30 trades, by number of winners:
| Winning trades | Win rate | Net profit (USD) |
|---|---|---|
| 9 | 30% | −300 |
| 10 | 33.3% | 0 |
| 11 | 36.7% | +300 |
| 12 | 40% | +600 |
| 13 | 43.3% | +900 |
Illustrative calculation as at 15 November 2026. Every win is counted at exactly +USD 200 and every loss at exactly −USD 100, with no trading costs.
The profit formula is 300 × winning trades − 3,000. With only 10 wins the account returns to its starting balance even after 20 losses. Each extra win adds USD 300, because it adds USD 200 of profit and removes a USD 100 loss.
Three benchmarks from this example:
- 1:1 needs 15 wins out of 30 to break even.
- 1:2 needs 10 wins, so losing twice as many trades as you win is still not a loss.
- 1:3 needs about 8 wins; with 7 wins the account is still down USD 200.
Still, 30 trades is a calculation example, not enough to judge a strategy. A win rate is only reliable after a few dozen to a few hundred recorded trades in a trading journal.
How Do Costs Raise The Breakeven Win Rate?
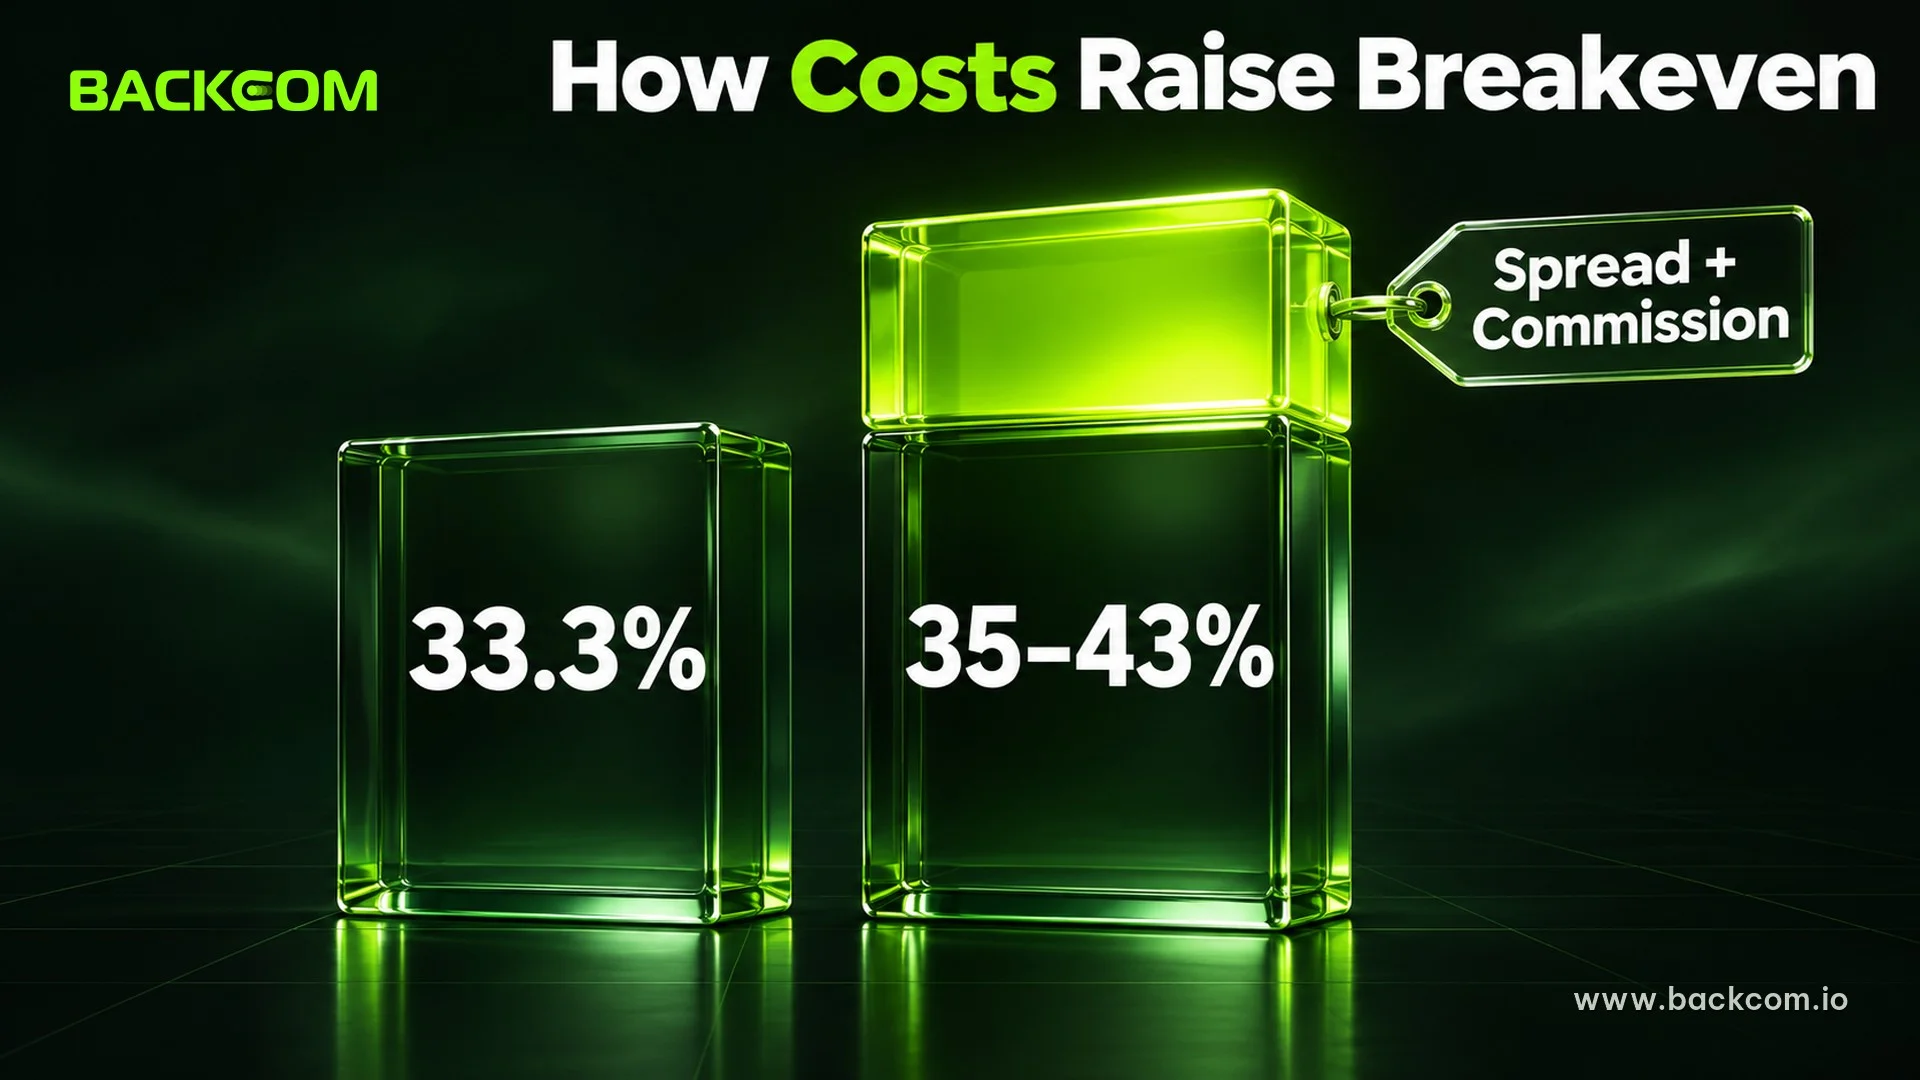
The formula 1 ÷ (1 + R) assumes free trading. In practice every trade pays the spread and may pay a commission. If you express the cost as a multiple of the risk, called c, the full formula becomes:
Real breakeven win rate = (1 + c) ÷ (1 + R)
Here c is the total cost of one trade divided by the stop-loss distance. For example, a spread plus commission of 1.5 pips with a 30-pip stop gives c = 0.05. The same cost with a 5-pip stop gives c = 0.3.
| Cost c | 1:1 ratio | 1:2 ratio | 1:3 ratio |
|---|---|---|---|
| 0 (no cost) | 50% | 33.3% | 25% |
| 0.05 (30-pip stop) | 52.5% | 35% | 26.3% |
| 0.15 (10-pip stop) | 57.5% | 38.3% | 28.8% |
| 0.30 (5-pip stop) | 65% | 43.3% | 32.5% |
Formula and figures calculated as at 15 November 2026. The 1.5-pip cost is an assumption for comparison; real costs depend on the broker, account type and pair.
This table shows why the shorter the stop, the more costs matter. A 1:2 strategy with a 5-pip stop needs a win rate near 43%, while the same ratio with a 30-pip stop needs only 35%. That is why scalpers have to watch costs more closely, as covered in what scalping is and how to cut costs.
Costs differ by broker and account type, so measure them on the exact account you trade. Any rebate received through an introducing broker lowers the net cost per trade, which makes c smaller. Current rebate levels for each broker are on the forex brokers page. Backcom.io is an independent introducing broker (IB/affiliate) of the brokers; rebates are paid from the commission the broker pays Backcom.io, see the risk disclaimer.
Why Risk Reward And Win Rate Cannot Be Separated
Expectancy combines the two. With p as the win rate and R as the reward, the expectancy per 1 unit of risk is:
Expectancy per trade = p × R − (1 − p)
It is a direct use of expected value, the probability-weighted average of the possible outcomes, as described on Wikipedia.
Read it directly: Expected value article on Wikipedia.
A few combinations show that a high ratio is not always profitable and a high win rate is not always safe:
| Win rate | Risk reward | Expectancy per trade |
|---|---|---|
| 30% | 1:3 | +0.20R |
| 35% | 1:2 | +0.05R |
| 40% | 1:2 | +0.20R |
| 50% | 1:1 | 0R |
| 60% | 1:0.5 | −0.10R |
| 70% | 1:0.3 | −0.09R |
Calculation as at 15 November 2026. 1R is the amount risked on one trade, for example USD 100 when risking 1% of a USD 10,000 account. Trading costs excluded.
The last two rows stand out. A strategy that wins 70% of trades still loses steadily if each win earns only 0.3 units while each loss costs 1. Sam Evans describes the same trade-off on FXStreet (24 September 2019) as a seesaw: some traders win only 20–30% of trades but win far more than they lose, while others win 45–65% of trades with smaller gains per trade.
Read it directly: FXStreet article comparing risk/reward ratio and win/loss ratio.
The reverse is also true. Raising the reward without changing the entry usually lowers the win rate, because price has to travel farther to reach the target. The two variables are linked, so you cannot pick a "nice" ratio at will and expect the win rate to stay the same.
5 Mistakes That Make The Ratio On Paper Differ From Reality
Most trades do not finish exactly as planned. These five mistakes are the most common reasons the real risk reward ratio ends up lower than the planned one.
- Stretching the take profit to make the ratio look good: placing the target at a price with no technical reason just to reach 1:3 pulls the win rate down without you noticing.
- Moving the stop loss farther away after entry: a plan with a 30-pip stop and a 60-pip target is 1:2, but widening the stop to 45 pips while keeping the target leaves 1:1.33 and lifts the breakeven rate from 33.3% to about 42.9%. This habit also shows up before accounts blow up, as covered in pyramiding in forex versus averaging down.
- Closing winners early: if a trader always closes at +1R, the real ratio is 1:1 and a 50% win rate is needed to break even, while losing trades still cost the full 1R.
- Ignoring costs in the ratio: a short stop plus a wide spread can push the breakeven of a 1:2 setup from 33% to above 43%.
- Treating 1:2 as enough: without a recorded win rate you cannot know whether you sit above or below the breakeven line.
A quick way to catch these is to add "planned risk reward" and "actual risk reward" columns to your trading journal and compare them every 30 trades.
Frequently Asked Questions (FAQ) About The Risk Reward Ratio
What Is A Good Risk Reward Ratio?
There is no single good number for every trader. A ratio is good only when, combined with your real win rate, it gives positive expectancy after costs. A trader who wins about 55% may do fine at 1:1, while one who wins 35% needs at least about 1:2.
What Win Rate Does A 1:2 Risk Reward Ratio Need?
At least about 33.3% before costs, which is 10 winning trades out of 30. Once spread and commission are included, the figure usually rises to roughly 35–43% depending on the stop-loss distance.
Should You Always Use A 1:3 Risk Reward Ratio?
No. A 1:3 ratio only needs a 25% win rate, but a distant target is reached less often and losing streaks get longer. The right ratio is the one your setup has proven with recorded data.
Does Risk Reward Replace Money Management?
No. Risk reward decides the edge of each trade, while money management decides how much each trade may lose. Risking too much per trade can still blow up an account during a normal losing streak.
Conclusion: Choose The Risk Reward Ratio By Calculation, Not By Feel
The risk reward ratio compares the maximum loss with the profit target on one trade. Traders need to look at three things together: the ratio, the recorded win rate, and the trading cost on the exact account they use.
Three things to do right away:
- Calculate the breakeven: use (1 + c) ÷ (1 + R) for every setup you trade.
- Record planned and actual risk reward: add both columns to the journal to see the gap caused by early exits or widened stops.
- Keep risk fixed: size each position from 1% of the account before you click.
If you are building your money management base, start with forex money management, the 1% rule and lot size.
Disclaimer: This content is compiled by Backcom.io for information only and is not investment advice or a trading recommendation. Forex and CFD trading uses leverage and carries a risk of losing capital; the numerical examples in this article are illustrative only.
Was this article helpful?
Join The Backcom.io Community
Get the latest on trading rebates, trading tips, and broker deals — and connect with thousands of traders worldwide.

Backcom App
Track Your Rebates Every Day
Every rebate is visible by broker and by day. Manage your wallet and withdrawals in one place.
Open Backcom App