Best Timeframe For Forex Trading: How To Choose Between M15, H1, H4 And D1 For Your Capital And Schedule


Open MetaTrader 5 and the same market tells different stories on each chart: M15 shows price plunging while D1 shows a mild pullback. That is why the best timeframe for forex trading is the first decision that shapes your stop loss, your position size and how long you sit at the screen. There is no single answer, only the timeframe that fits your capital and your free hours.
In this article, Backcom.io measures M15, H1, H4 and D1 candles on real gold prices, calculates the minimum capital for each timeframe, then walks through a three-timeframe analysis of one downtrend.
1. What Are Forex Trading Timeframes And What Does Each Candle Tell You?
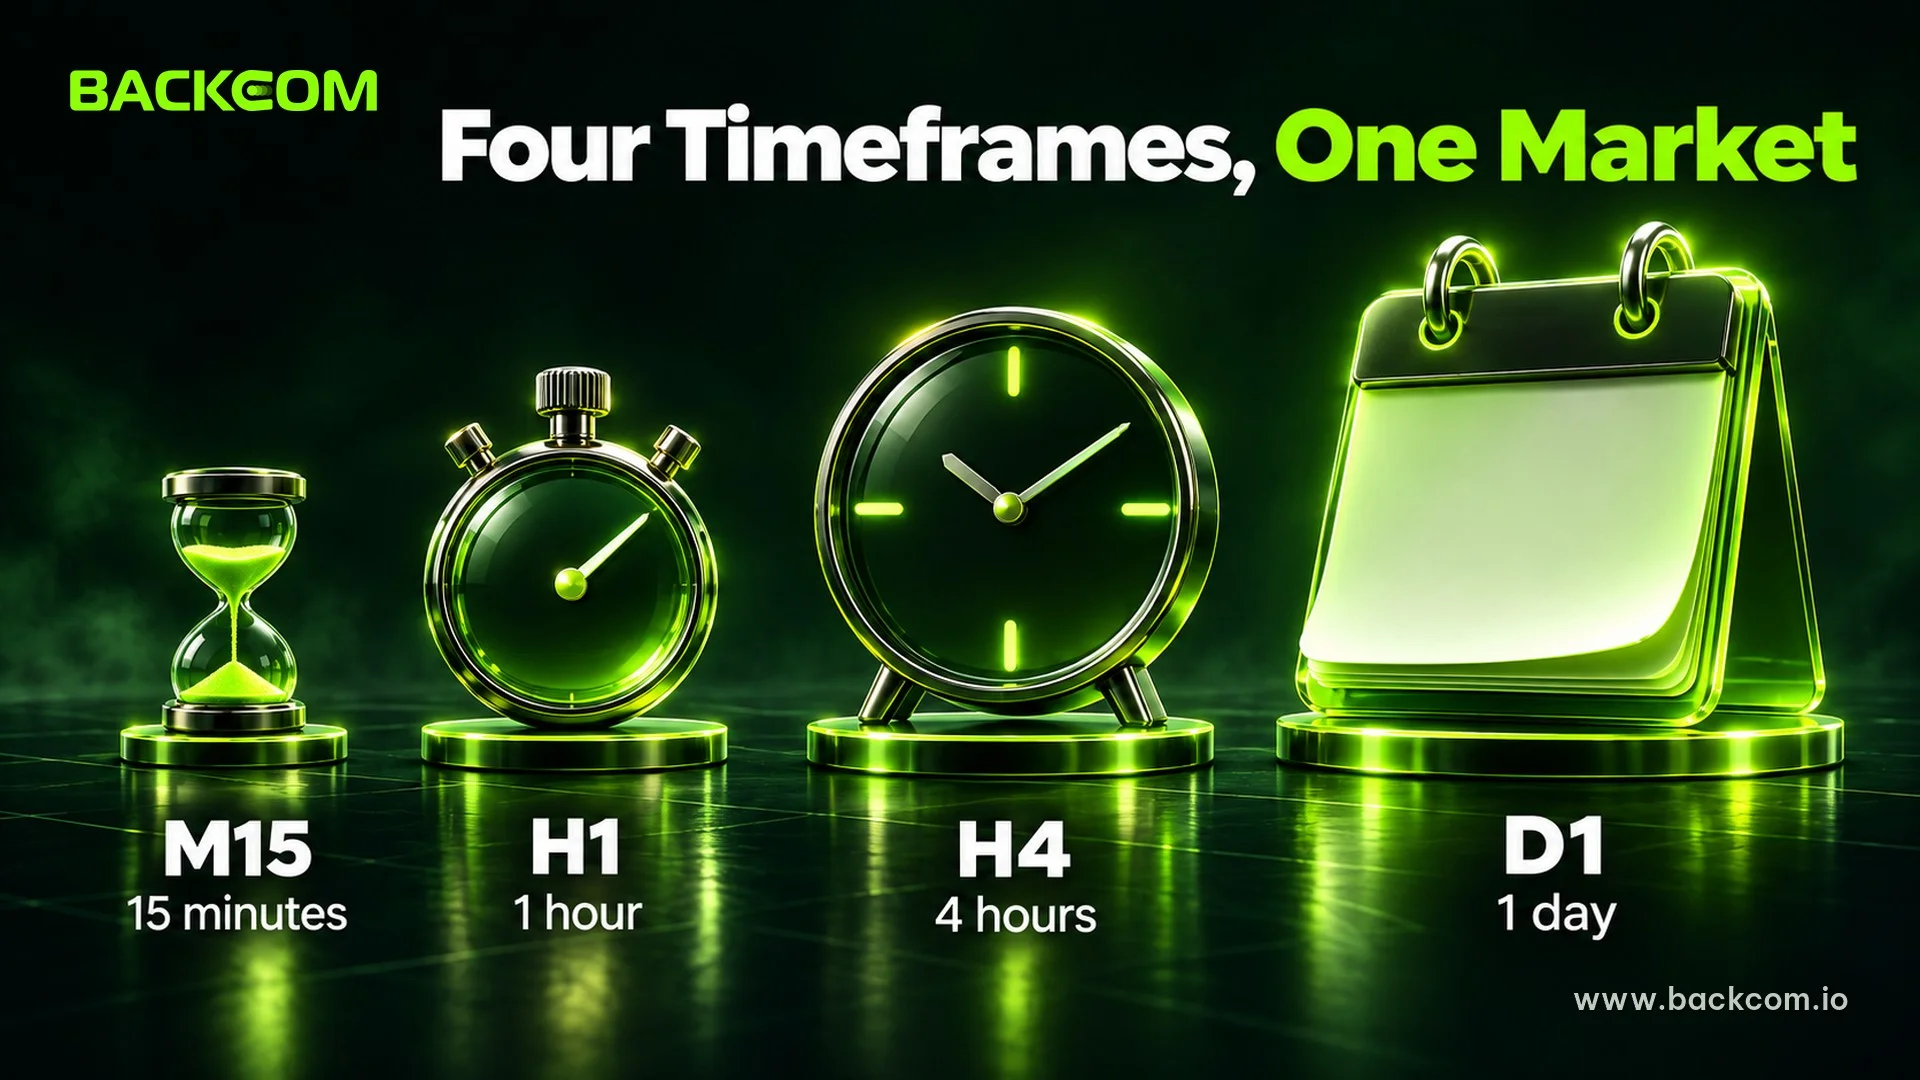
Forex trading timeframes set how much time one candle covers: an M15 candle groups 15 minutes of price, H1 groups one hour, H4 groups four hours and D1 groups a full trading day. Each candle records four prices (open, high, low and close), so the same stretch of price can appear as 96 M15 candles or a single D1 candle.
MetaTrader 5 offers 21 timeframes, from 1 minute to 1 month. According to the official MetaTrader 5 help page, the M1 to M15 range is typically used for short-term scalping, while M30 to H4 suits intraday trading.
The naming is simple:
- M (minute): M1, M5, M15 and M30 are minute candles.
- H (hour): H1 and H4 are hourly candles, so the H1 vs H4 timeframe question comes up constantly.
- D1, W1, MN: daily, weekly and monthly candles.
Smaller timeframes produce more candles and more noise, while larger ones produce fewer candles that each carry more information. A timeframe does not change where the market is going. It only changes the magnification you look through.
2. H1 Vs H4 Timeframe: How Do M15, H1, H4 And D1 Compare On Real Gold Data?
The H1 vs H4 timeframe choice is the one most intraday traders face, because both are small enough to show entries yet large enough to filter noise. To turn the difference into numbers, the table below measures the average range (high minus low) of the latest 20 candles on COMEX gold futures (GC).
| Timeframe | Candles per day | Average range (USD/ounce) | Versus H1 |
|---|---|---|---|
| M15 | 96 | 7.42 | 0.5x |
| H1 | 24 | 15.35 | 1x |
| H4 | 6 | 30.62 | 2.0x |
| D1 | 1 | 87.80 | 5.7x |
Data: GC=F candles from Yahoo Finance, retrieved on 14 November 2026. M15 covers 80 candles from 02:00 to 21:45 UTC on 13 November (the same window as H1), H1 covers 02:00 to 21:00 UTC on 13 November, H4 covers 16:00 on 10 November to 20:00 on 13 November, D1 covers 19 October to 13 November. This is past price data, not a trading recommendation.
An average D1 candle is about 5.7 times longer than an H1 candle, so the same trade needs a far wider stop on D1. The Yahoo Finance data is a futures contract, so spot XAUUSD at your broker differs slightly, but the relationship between timeframes holds.
3. What Is The Best Timeframe For Forex Trading With A Small Account?
With a small account, the best timeframe is the one that lets you place a tight stop while keeping risk per trade near 1% of capital. The 1% rule is explained in forex money management and the 1% rule, and the calculation below simply combines it with the ranges from section 2.
Assume gold has a 100-ounce contract per lot, as many brokers list, so 0.01 lot equals 1 ounce and a 1 USD move gains or loses 1 USD. If the stop is exactly one average candle of the timeframe in use, the result is:
| Timeframe | Stop of 1 candle | Loss at 0.01 lot | % of a 1,000 USD account | Minimum capital for a loss of 1% or less |
|---|---|---|---|---|
| M15 | 7.42 USD | 7.42 USD | 0.7% | 742 USD |
| H1 | 15.35 USD | 15.35 USD | 1.5% | 1,535 USD |
| H4 | 30.62 USD | 30.62 USD | 3.1% | 3,062 USD |
| D1 | 87.80 USD | 87.80 USD | 8.8% | 8,780 USD |
Calculation as of 14 November 2026, based on the ranges in section 2 and an assumed 100 ounces per lot. Check the contract specification on your broker's MT5 before applying it.
A 1,000 USD account exceeds the 1% limit with an H1-sized stop at the smallest 0.01 lot, while an M15-sized stop costs only 0.7%. Traders with small capital therefore tend to take one of two paths:
- Use a smaller timeframe: an M15-sized stop, in exchange for more noise and more spread.
- Use a cent account: finer lot steps, as discussed in how much money to trade forex.
D1 needs 8,780 USD for 0.01 lot, so it rarely fits an account of a few hundred dollars.
4. Which Timeframe Fits Your Free Time And Trading Style?
Trading style decides the timeframe more than personal taste, because each style holds trades for a different time and needs a different level of monitoring.
Three common groups:
- Scalping (M1 to M15): trades last minutes, need constant attention and repeat the spread cost many times, as covered in what is scalping.
- Day trading (M15 to H4): trades open and close within the day, usually before the overnight swap.
- Swing trading (H4 to D1): trades last days and need one or two chart checks per day.
A trader with a full-time job often suits H4 and D1, since pending orders placed in the evening can run with automatic stops and targets. A trader with several free hours during the London or New York session may use H1 as the main chart, checking session times with the forex market hours tool.
One rule is easy to miss: choose a timeframe by the time you actually have, not the time you wish you had. M15 demands continuous watching, and an M15 trade left unattended during a news release can turn into a different trade from the plan.
5. How Does Multi Timeframe Analysis Start? Find The Trend On D1
Multi timeframe analysis looks at one market through three charts in order from large to small: the large timeframe gives direction, the middle one gives the pullback and the small one gives the entry. This is also how the charts below are read:
- Large timeframe (D1): decide whether the trend is up, down or sideways.
- Middle timeframe (H4): find the pullback or correction inside that trend.
- Small timeframe (H1): choose the entry and the stop location.
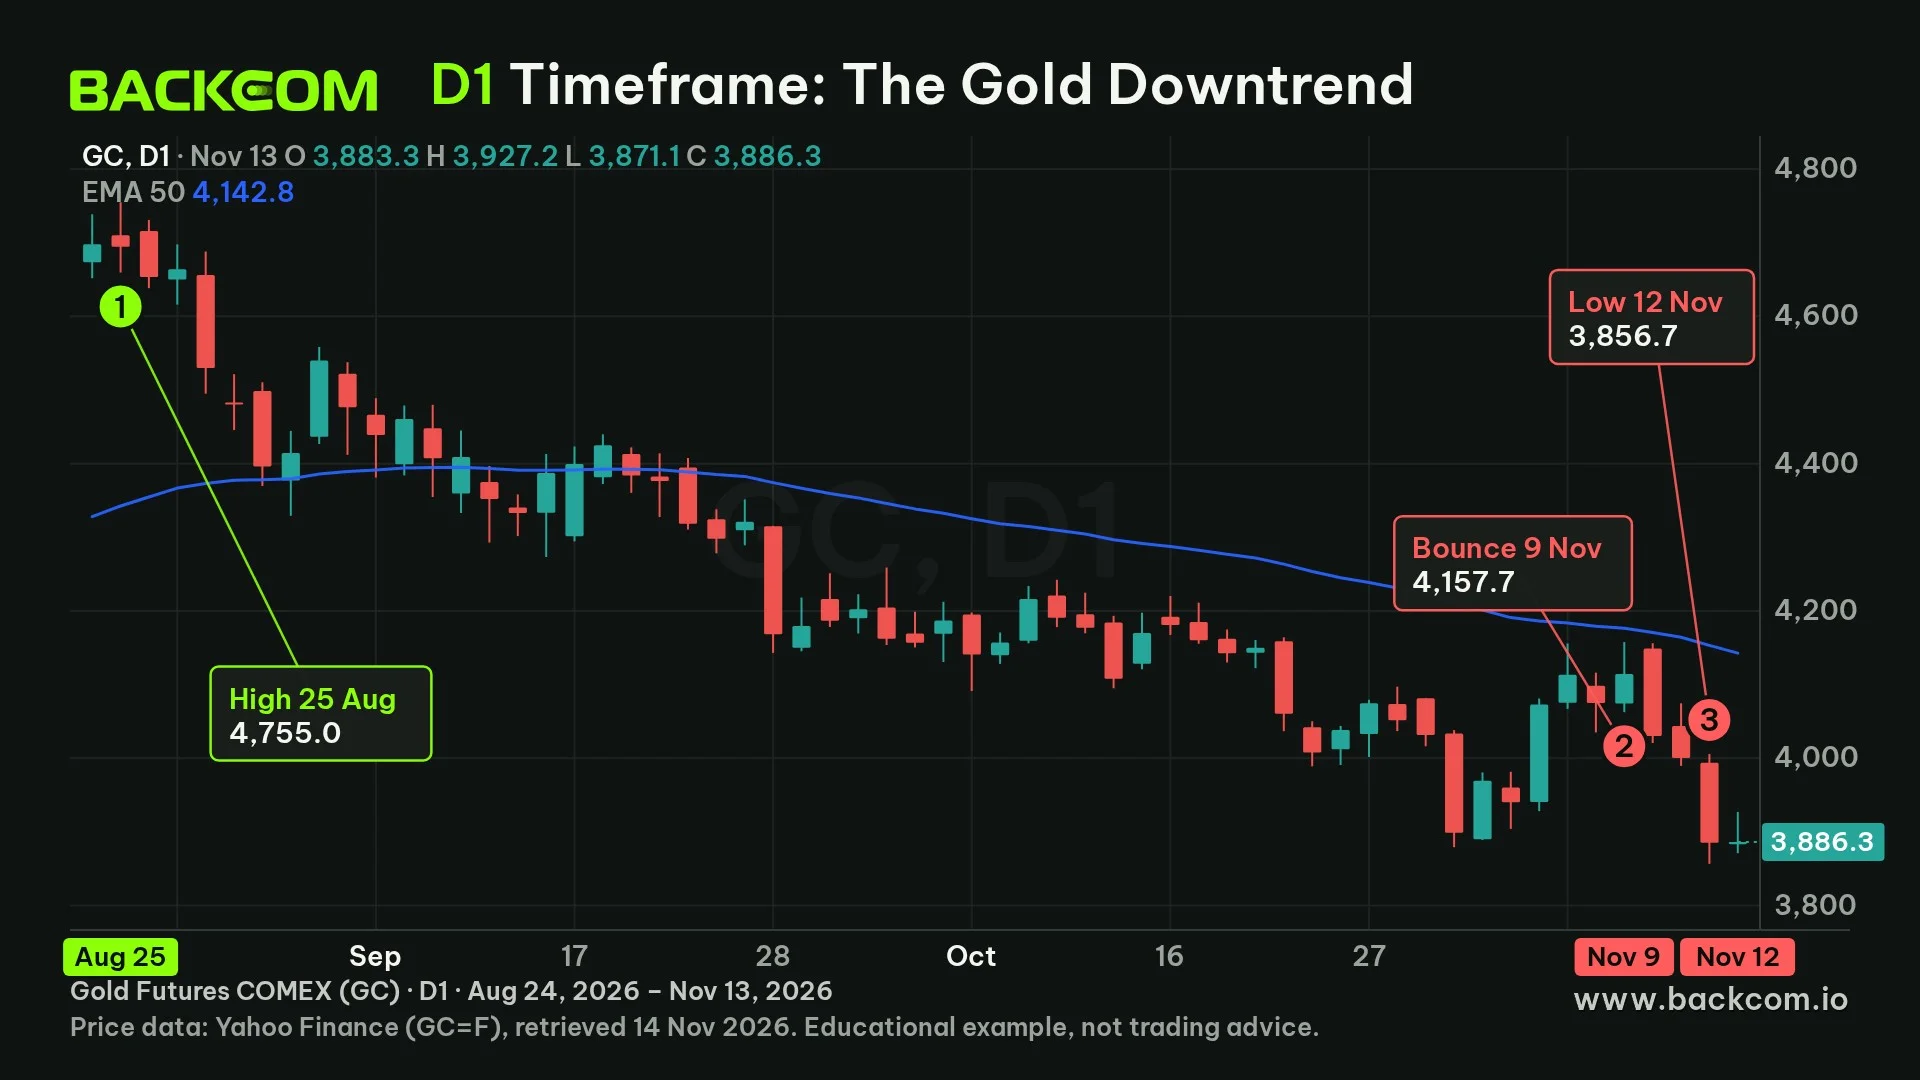
On D1, gold GC fell from a high of 4,755.0 on 25 August 2026 to a low of 3,856.7 on 12 November 2026, a drop of 898.3 USD or 18.9%. Price sits below the 50-period EMA (4,142.8 on 13 November), and the 9 November bounce only reached 4,157.7 before turning down.
The downtrend did not run in a straight line. From the D1 candle low of 3,889.0 on 2 November, gold bounced to 4,155.8 on 5 November, a gain of 266.8 USD (6.9%) and about 8.7 times the average H4 range, against the D1 direction for three days running. A sell with a stop of one H4 candle (about 30 USD) would have been stopped out in this bounce. Multi timeframe analysis does not remove such pullbacks, it only helps traders wait for H4 to confirm the bounce has run out of strength.
The D1 conclusion is a single sentence: the trend is down, so a trend follower looks for sells and avoids catching the bottom.
6. What Is The H4 Timeframe For? Find The Pullback Inside The Trend
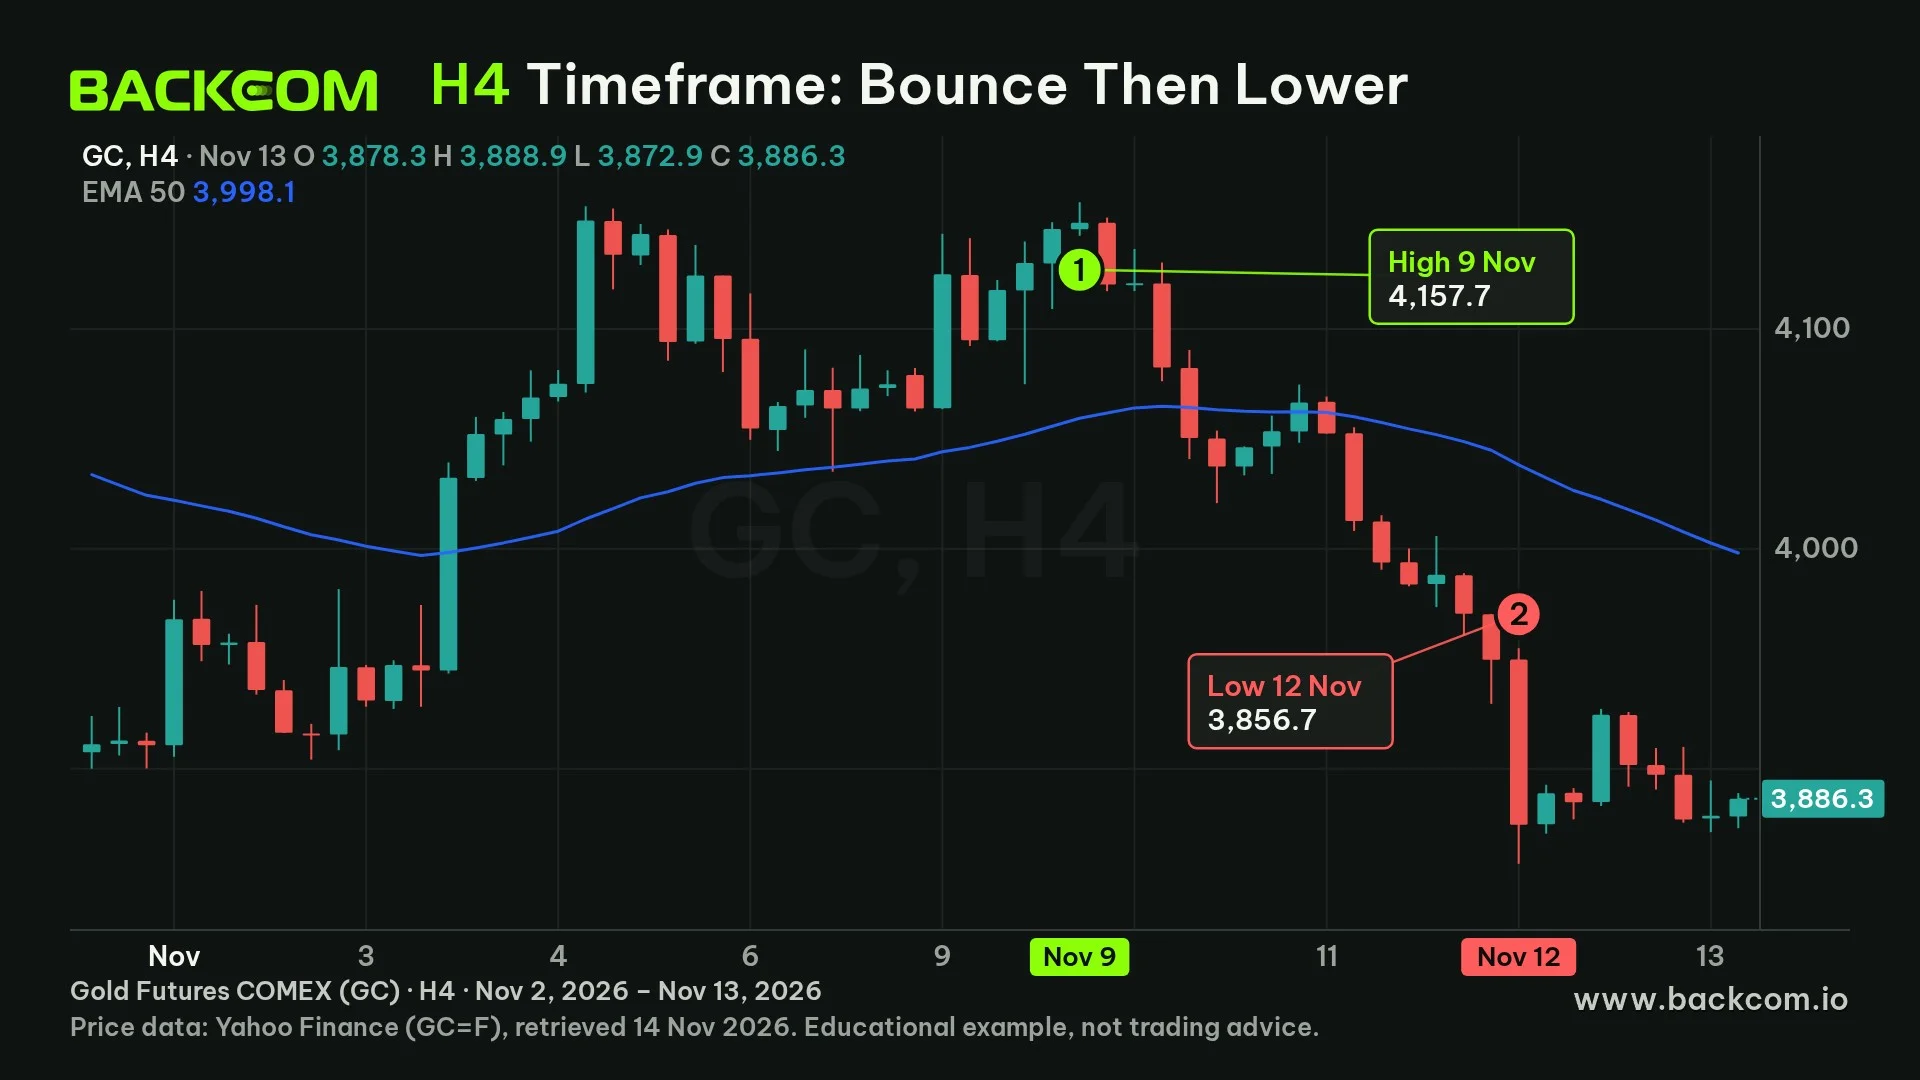
The H4 timeframe is the middle chart, used to see the pullback structure that D1 squeezes into one or two candles. On H4, price bounced from a low of 3,900.0 at 00:00 UTC on 2 November to a high of 4,157.7 late on 9 November, then fell in one stretch to a low of 3,856.7 inside the H4 candle opened at 12:00 UTC on 12 November.
That fall is 301.0 USD long, or 7.2% of price, in about three days. A D1 candle folds this stretch into a few bodies, while H4 shows when the bounce ran out of strength and price dropped under the 50-period EMA.
For a trend follower this is the waiting step: the large timeframe has given the sell direction, so the H4 job is to confirm the pullback is exhausted instead of entering while price is still rising.
7. What Is The H1 Timeframe For? Pick The Entry And The Stop
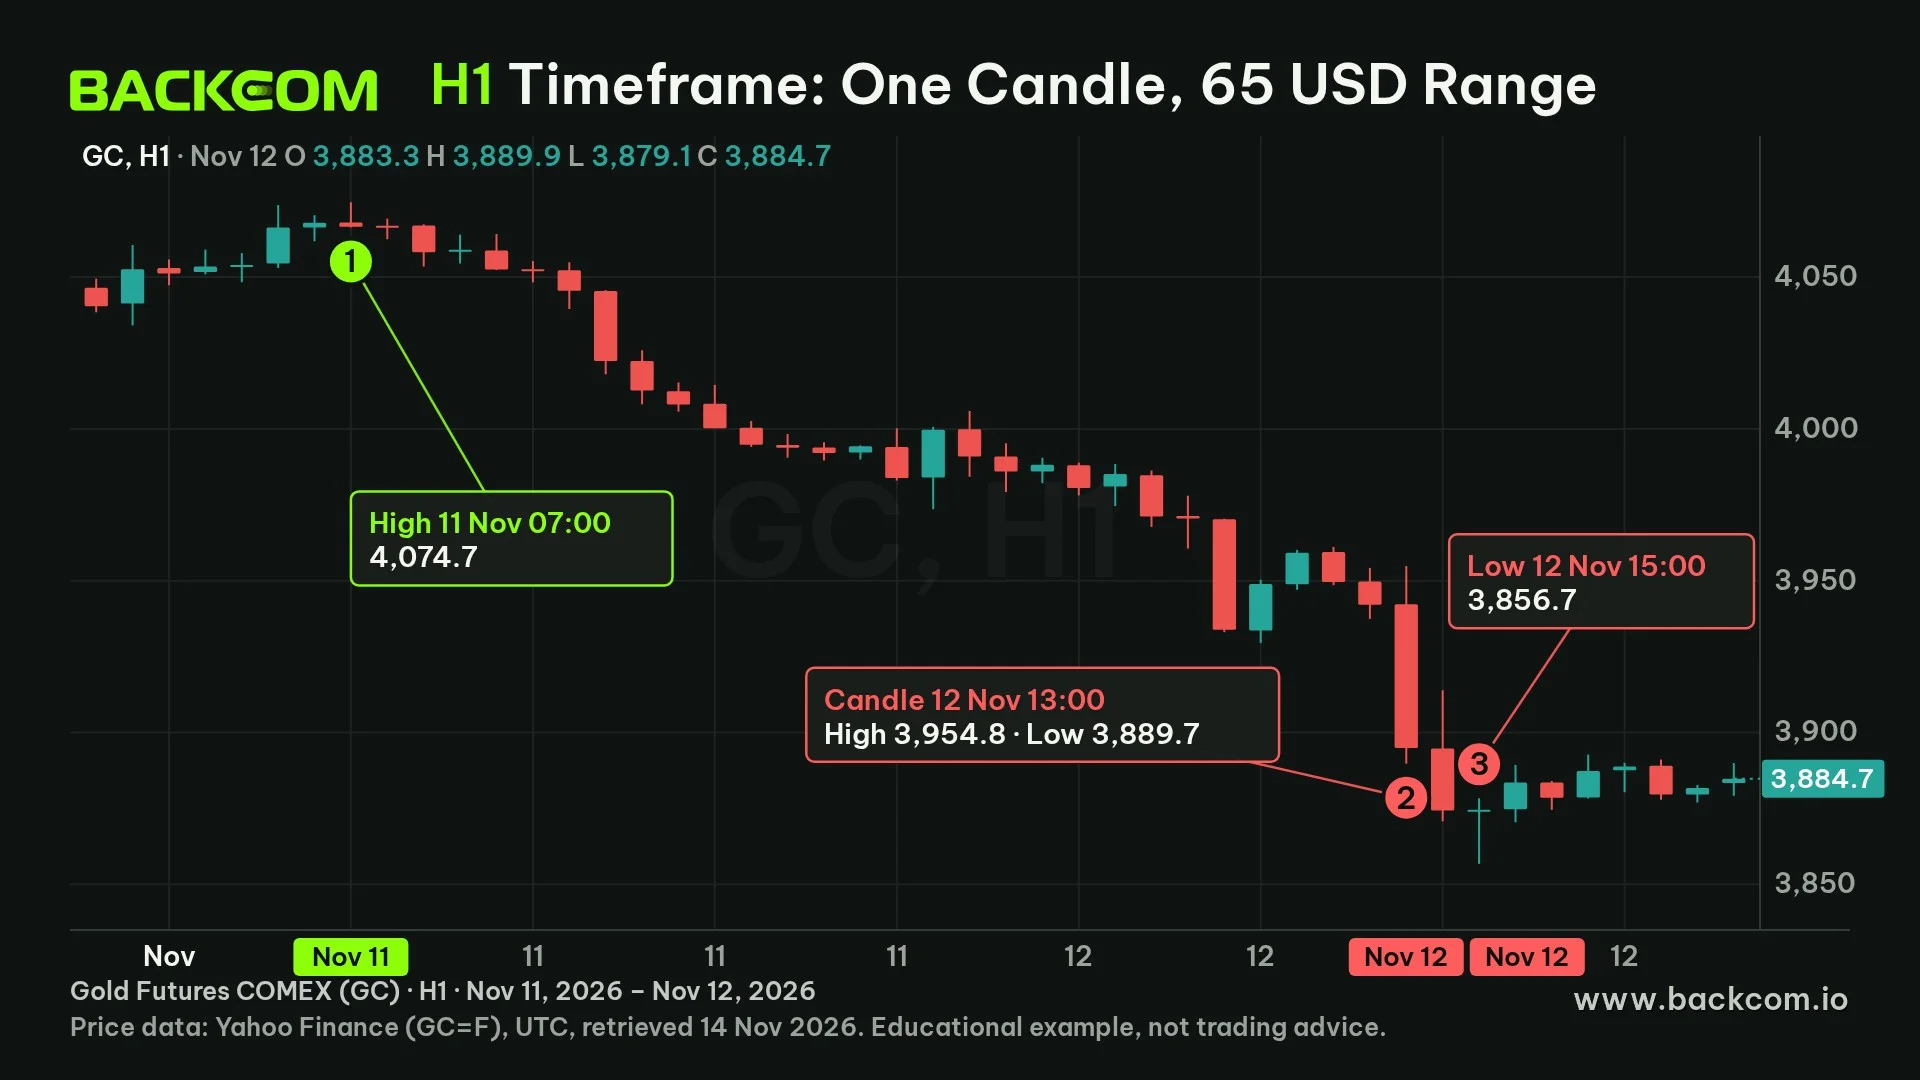
The H1 timeframe is the small chart used to choose a more precise entry and stop, but it is also where noise misleads traders most. On H1, price fell from 4,074.7 at 07:00 UTC on 11 November to 3,856.7 at 15:00 UTC on 12 November, which is 218.0 USD in 32 hours.
The H1 candle at 13:00 UTC on 12 November stands out, with a high of 3,954.8 and a low of 3,889.7, a range of 65.1 USD. That one candle shows three things:
- About 4.2 times the average H1 range of 15.35 USD.
- 44% of the 149.2 USD range of the whole D1 candle on 12 November.
- Far larger than a 15 USD stop, so a buy with that stop opened at the start of that hour would have been closed within it.
This is why small timeframes should only be used once the large timeframe has given a direction. Viewed alone, H1 throws up dozens of small signals, and most are noise around a trend already clear on D1. For stops placed at an invalidation point, see how to set a stop loss, and for measuring candle range see the ATR indicator.
8. What Is The Best Timeframe For Beginners And Which Mistakes To Avoid?
The best timeframe for beginners is one slow enough to leave time to think, usually H1 or H4, paired with a larger chart for direction. Beginners should avoid M1 and M5 because the spread takes a large share of every trade and emotional reactions overrule the plan.
A simple routine for beginners:
- Pick one main timeframe (H1 or H4) and a larger chart to set direction (for example H4 above H1, or D1 above H4).
- Keep those two charts for at least several dozen trades before thinking of a change.
- Record the timeframe used in your trading journal so you learn which one really suits you.
- Backtest the strategy on the chosen timeframe before risking real money, as in how to backtest an EA in MT5.
The most common mistake is switching timeframe after a loss. A trade stopped out on H1 easily pushes a trader down to M5 in search of a more precise entry, when the real problem is a stop that was too tight for the candle range. Opening too many charts at once also creates conflicting signals, so three timeframes are enough.
Frequently Asked Questions (FAQ) About Forex Trading Timeframes
What Is The Most Accurate Timeframe In Forex?
No timeframe is more accurate than another. Large timeframes filter noise better but need wider stops, while small ones give tidy entries with more false signals. The gold example shows an average D1 candle of 87.80 USD against 15.35 USD on H1, so accuracy depends on whether the timeframe fits your capital and risk management.
Should You Trade The H1 Or H4 Timeframe?
If you look at charts only a few times a day, H4 fits better, while a trader with several free hours in a session can use H1. With the same 1% risk rule, H4 needs twice the capital of H1 in the section 3 calculation (3,062 versus 1,535 USD for 0.01 lot of gold).
Do You Need To Watch Several Timeframes At Once?
Yes, but only two or three. The large chart gives direction, the middle one the pullback and the small one the entry. Using too many timeframes usually creates conflicting signals and leaves traders hesitating.
Does The Timeframe Affect Trading Costs?
Yes. Small timeframes generate more trades, so total spread and commission add up faster, while trades held overnight on large timeframes may pay swap fees. Traders should add both costs for their own style instead of looking only at the spread.
Conclusion: Choose By Capital And Time, Then Stay Consistent
The best timeframe for forex trading should be chosen from three factors at once: capital sets the stop length you can afford, free time sets the timeframe you can monitor, and trading style sets the number of trades. The gold data shows that each larger timeframe raises both the candle range and the minimum capital, so pick the timeframe before you pick the lot size.
The next step is to choose one main timeframe plus a larger one, backtest it and trade it steadily before changing. Beginners can start with forex trading for beginners, and traders comparing broker conditions and rebates can browse the broker pages. Backcom.io is an independent introducing broker (IB/affiliate) of the brokers listed there, and rebates are paid from the commission the broker pays Backcom.io, see the risk disclaimer.
Disclaimer: This content is compiled by Backcom.io for information only and is not investment advice, a trading recommendation or financial advice. Examples on gold prices use past data, and leveraged trading carries a risk of losing your capital.
Was this article helpful?
Join The Backcom.io Community
Get the latest on trading rebates, trading tips, and broker deals — and connect with thousands of traders worldwide.

Backcom App
Track Your Rebates Every Day
Every rebate is visible by broker and by day. Manage your wallet and withdrawals in one place.
Open Backcom App