ATR Indicator Explained: How To Calculate Average True Range And Use It For Stop Loss And Lot Size

A trader sets a 40-dollar stop loss on gold and gets knocked out within a few sessions, even though price later moves in the direction of the original idea. The cause is often that the stop distance was never measured against how far the market normally moves, and that is exactly the question the ATR indicator answers.
In this article, Backcom.io will cover what traders most often ask about this tool:
- What the ATR indicator is and why it measures size of movement, not direction.
- How to calculate ATR from the True Range of each candle, with a hand calculation on a real gold chart.
- How to read ATR 14 when the market tightens or expands.
- How to use an ATR stop loss and position sizing, with statistics on gold and EUR/USD.
What Is The ATR Indicator? A Measure Of Price Range, Not Direction
The ATR indicator (Average True Range) measures the average size of price movement over a set number of recent candles, expressed in the price units of the instrument. On gold it reads in US dollars per ounce, and on EUR/USD it reads in decimal places or pips.
The key point is that ATR measures only the size of volatility. According to TradingView's ATR support page, it is a metric used solely to measure volatility, not price direction. A big down candle and a big up candle raise ATR by the same amount.
J. Welles Wilder introduced the indicator in 1978 in his book New Concepts in Technical Trading Systems. According to StockCharts ChartSchool, he designed it mainly for commodities and daily data, to capture the gaps that a candle's high-low range misses.
You should therefore think of ATR as a ruler for market noise:
- High ATR means each candle is travelling far, so a tight stop is easily hit.
- Low ATR means the market is compressed, so the same stop looks wider against the rhythm of price.
- ATR does not signal buy or sell, so it needs a separate method for choosing direction.
How To Calculate ATR: The Average True Range Formula
How to calculate ATR takes two steps: work out the True Range of every candle, then smooth those True Range values with Wilder's formula. Both steps are simple enough to do by hand.
True Range Of One Candle
True Range (TR) is the largest of three distances. The formula on one line:
TR = the largest of [High − Low ; |High − Previous close| ; |Low − Previous close|]
The last two terms exist because of gaps. When price opens far from the previous close, the candle's own high-low range misses the part of the move that jumped. True Range adds that jump back.
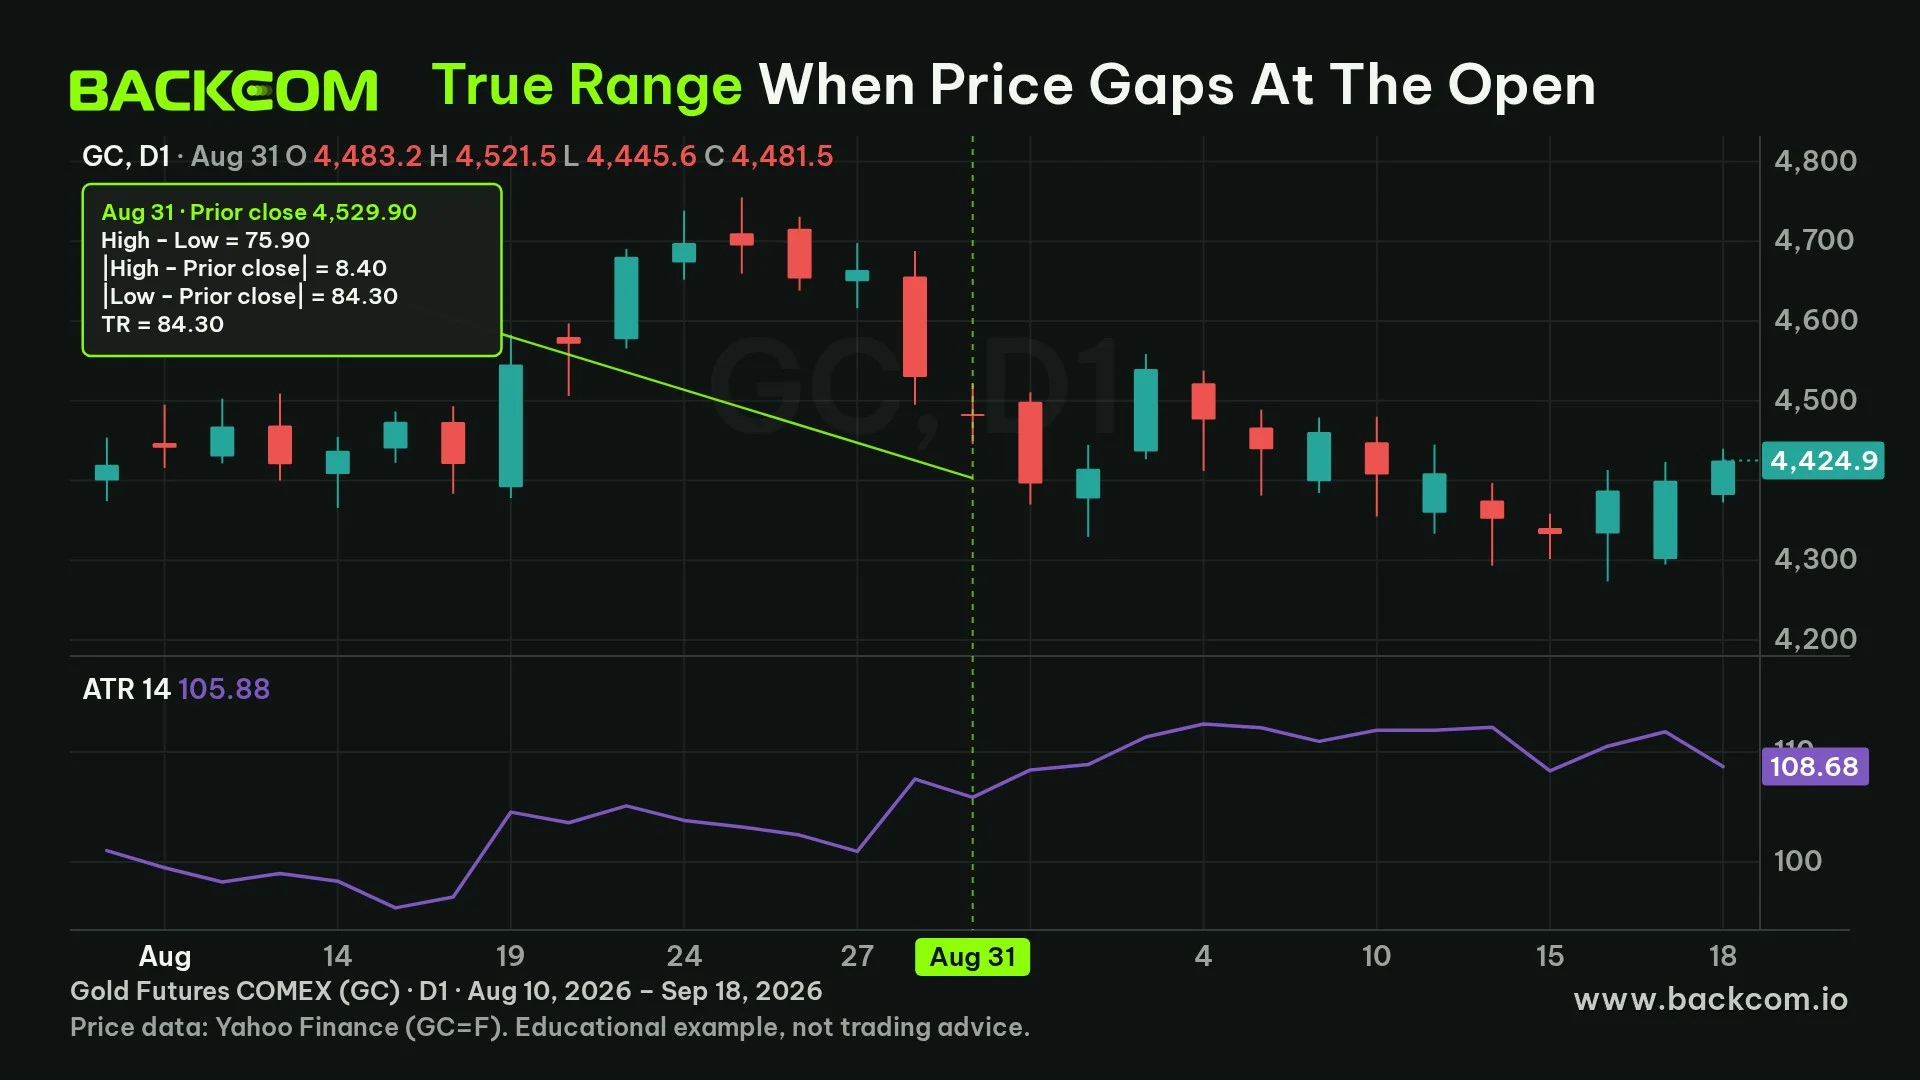
Here is a real example on the COMEX gold futures contract (GC), the daily candle of 31 August 2026:
- Previous close (28 August): 4,529.90.
- High 4,521.50, low 4,445.60, so High − Low = 75.90.
- |High − Previous close| = |4,521.50 − 4,529.90| = 8.40.
- |Low − Previous close| = |4,445.60 − 4,529.90| = 84.30.
The largest value is 84.30, so the TR of this candle is 84.30 dollars, which is 8.40 more than the plain high-low range. The candle opened below the previous close, so the gap down is counted.
Data: GC=F daily candles from Yahoo Finance, retrieved on 8 November 2026, ATR calculated by the Wilder method. This is past price data, not a trade recommendation.
The Wilder ATR 14 Formula
ATR 14 is a smoothed average of the last 14 True Range values. The first ATR is the simple average of the first 14 True Range values, and from the 15th candle onward the formula is:
Current ATR = (Previous ATR × 13 + Current TR) ÷ 14
Apply it to the 31 August 2026 gold candle, where the previous ATR was 107.54 and the current TR is 84.30:
- New ATR = (107.54 × 13 + 84.30) ÷ 14 = (1,398.02 + 84.30) ÷ 14 = 105.88.
- This candle had a TR below the old ATR, so ATR eased down from 107.54 to 105.88.
This smoothing behaves like an exponential moving average, so each new candle only pulls ATR a small way. TradingView describes its default smoothing as RMA, which is Wilder's moving average. If you switch to SMA, EMA or WMA in the settings, the number will differ slightly.
How To Read The ATR Indicator On A Chart
The ATR indicator appears in its own panel under the price chart as a single line, and a period of 14 is the most common default. You can change the period, but a shorter one reacts faster to one unusual candle.
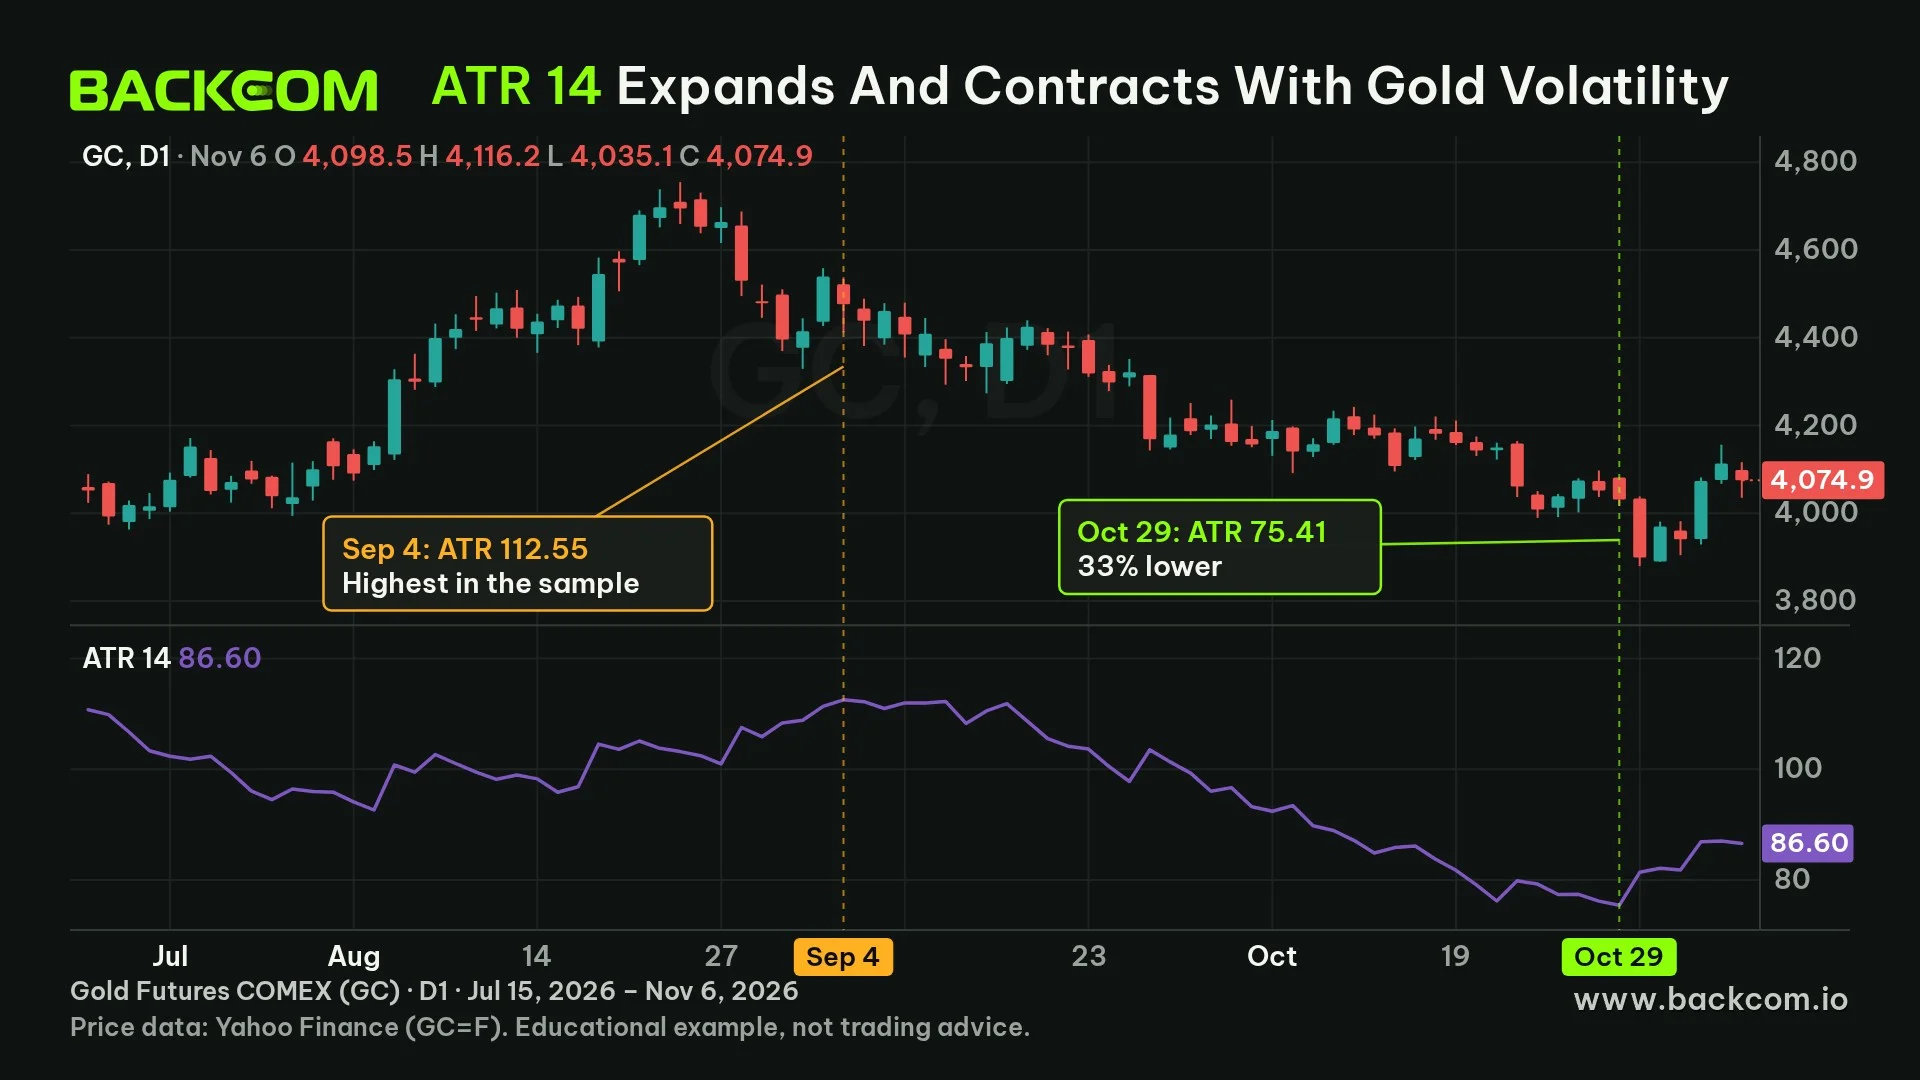
On the daily gold chart above, ATR 14 peaked at 112.55 on 4 September 2026 and then slid to 75.41 on 29 October 2026, about 33% lower. Over that same stretch gold was falling, not rising, so a lower ATR does not mean price is reversing.
Data: GC=F daily candles from Yahoo Finance, retrieved on 8 November 2026, ATR 14 calculated by the Wilder method. This is past price data, not a trade recommendation.
Keep three points in mind when reading ATR:
- ATR rising: candles are getting wider, often alongside strong news or an accelerating trend.
- ATR falling: the market is compressing and swings are shrinking, but this does not time the next breakout.
- ATR cannot be compared across instruments: 86.60 on gold and 0.00631 on EUR/USD use different units, so compare ATR only for the same instrument and the same timeframe.
ATR on the H1 chart and on the daily chart gives very different numbers. Traders who hold for several days should read daily ATR, while intraday traders need the ATR of the timeframe they enter on.
On MetaTrader 5, ATR sits in the Oscillators group. The MetaTrader 5 help page describes ATR as a moving average of True Range values. It does not state the smoothing type, so the figure on MT5 may differ slightly from TradingView, and you should check it on the platform you actually use.
ATR Stop Loss: Setting The Distance With A Multiplier
An ATR stop loss sets the distance from entry to stop as a multiple of ATR instead of a fixed number of pips. The formula for a buy order:
Buy stop loss = Entry price − (Multiplier × ATR)
For a sell order you add instead of subtract. The article on how to set a stop loss explains why the stop should still sit at the invalidation point of the idea, with ATR used to check whether the stop is too tight for normal noise.
How Often Does Each Multiplier Get Hit?
To see how the multiplier matters, Backcom.io counted on real daily data. The rule: treat every daily close as a hypothetical buy entry, place a level k × ATR(14) below that close using the ATR of the same candle, then check whether the lowest price of the next 1 session and the next 5 sessions touched the level. This measures noise, not a profitable strategy.
| Distance of the level | Gold (GC): hit within 1 session | Gold: hit within 5 sessions | EUR/USD: hit within 1 session | EUR/USD: hit within 5 sessions |
|---|---|---|---|---|
| 1 × ATR | 12.6% | 40.3% | 9.8% | 44.2% |
| 1.5 × ATR | 4.8% | 24.0% | 3.7% | 26.9% |
| 2 × ATR | 1.6% | 15.1% | 1.1% | 15.3% |
| 3 × ATR | 0.5% | 5.3% | 0.0% | 4.2% |
| Fixed 40 dollars (gold) / 30 pips (EUR/USD) | 40.5% | 68.0% | 43.8% | 74.0% |
Data: GC=F and EURUSD=X daily candles from Yahoo Finance, retrieved on 8 November 2026. The gold sample has 437 candles from 6 February 2025 to 30 October 2026, and the EUR/USD sample has 457 candles from 30 January 2025 to 30 October 2026. EUR/USD daily candles are built from 1-hour candles by UTC day, so they differ slightly from a broker chart. This is past price data, not a trade recommendation.
The table shows two things. A fixed 40-dollar level on gold equals roughly 0.4 times the sample's average ATR (96.22 dollars), so it was touched within 5 sessions 68.0% of the time, while a 2 × ATR level was touched only 15.1% of the time. Likewise, 30 pips on EUR/USD is about 0.4 times the average ATR of roughly 72 pips.
The table does not say which multiplier is right. A larger multiplier is hit less often but forces a smaller lot, and the table does not count whether price later went in the intended direction.
Example: A Fixed Stop Versus A 1.5 × ATR Stop On Gold
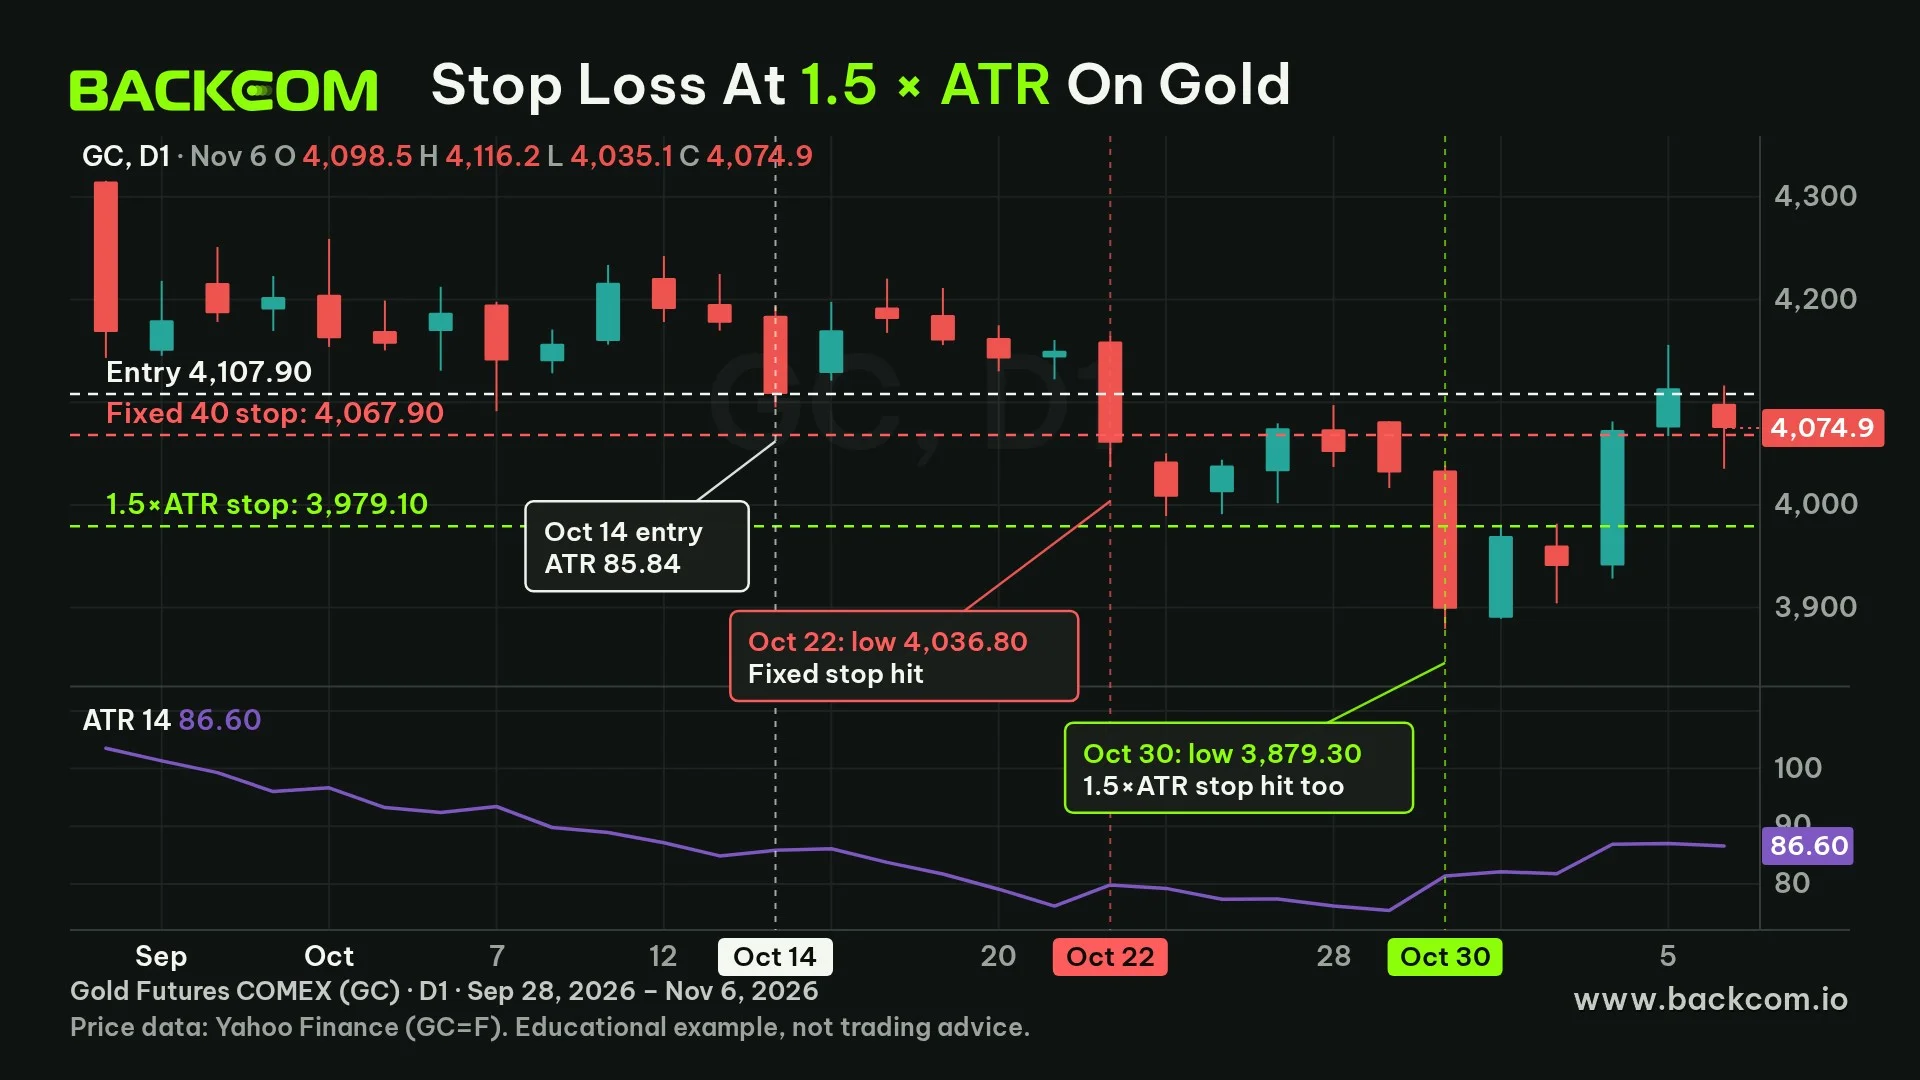
Suppose a trader buys gold at the 14 October 2026 daily close of 4,107.90, when ATR 14 equals 85.84. Two ways of placing the stop give different results:
- Fixed 40-dollar stop: level 4,067.90. The 22 October low was 4,036.80, so the stop was hit on the 6th session after entry.
- 1.5 × ATR stop: distance 1.5 × 85.84 = 128.76, rounded to 128.80, so the stop is at 3,979.10. It survived the 22 October flush and was hit on 30 October when price dropped to 3,879.30, the 12th session.
Over those 12 sessions the highest close was 4,181.10 on 16 October, 73.20 above the entry. Both stops were eventually hit, so this example does not prove that ATR "wins". It shows that an ATR stop stays outside ordinary noise for longer, at the price of a larger loss per ounce (128.80 dollars versus 40 dollars).
Data: GC=F daily candles from Yahoo Finance, retrieved on 8 November 2026, assuming a fill exactly at the stop price and ignoring spread and slippage. This is past price data, not a trade recommendation.
ATR Position Sizing: From Stop Distance To Lot Size
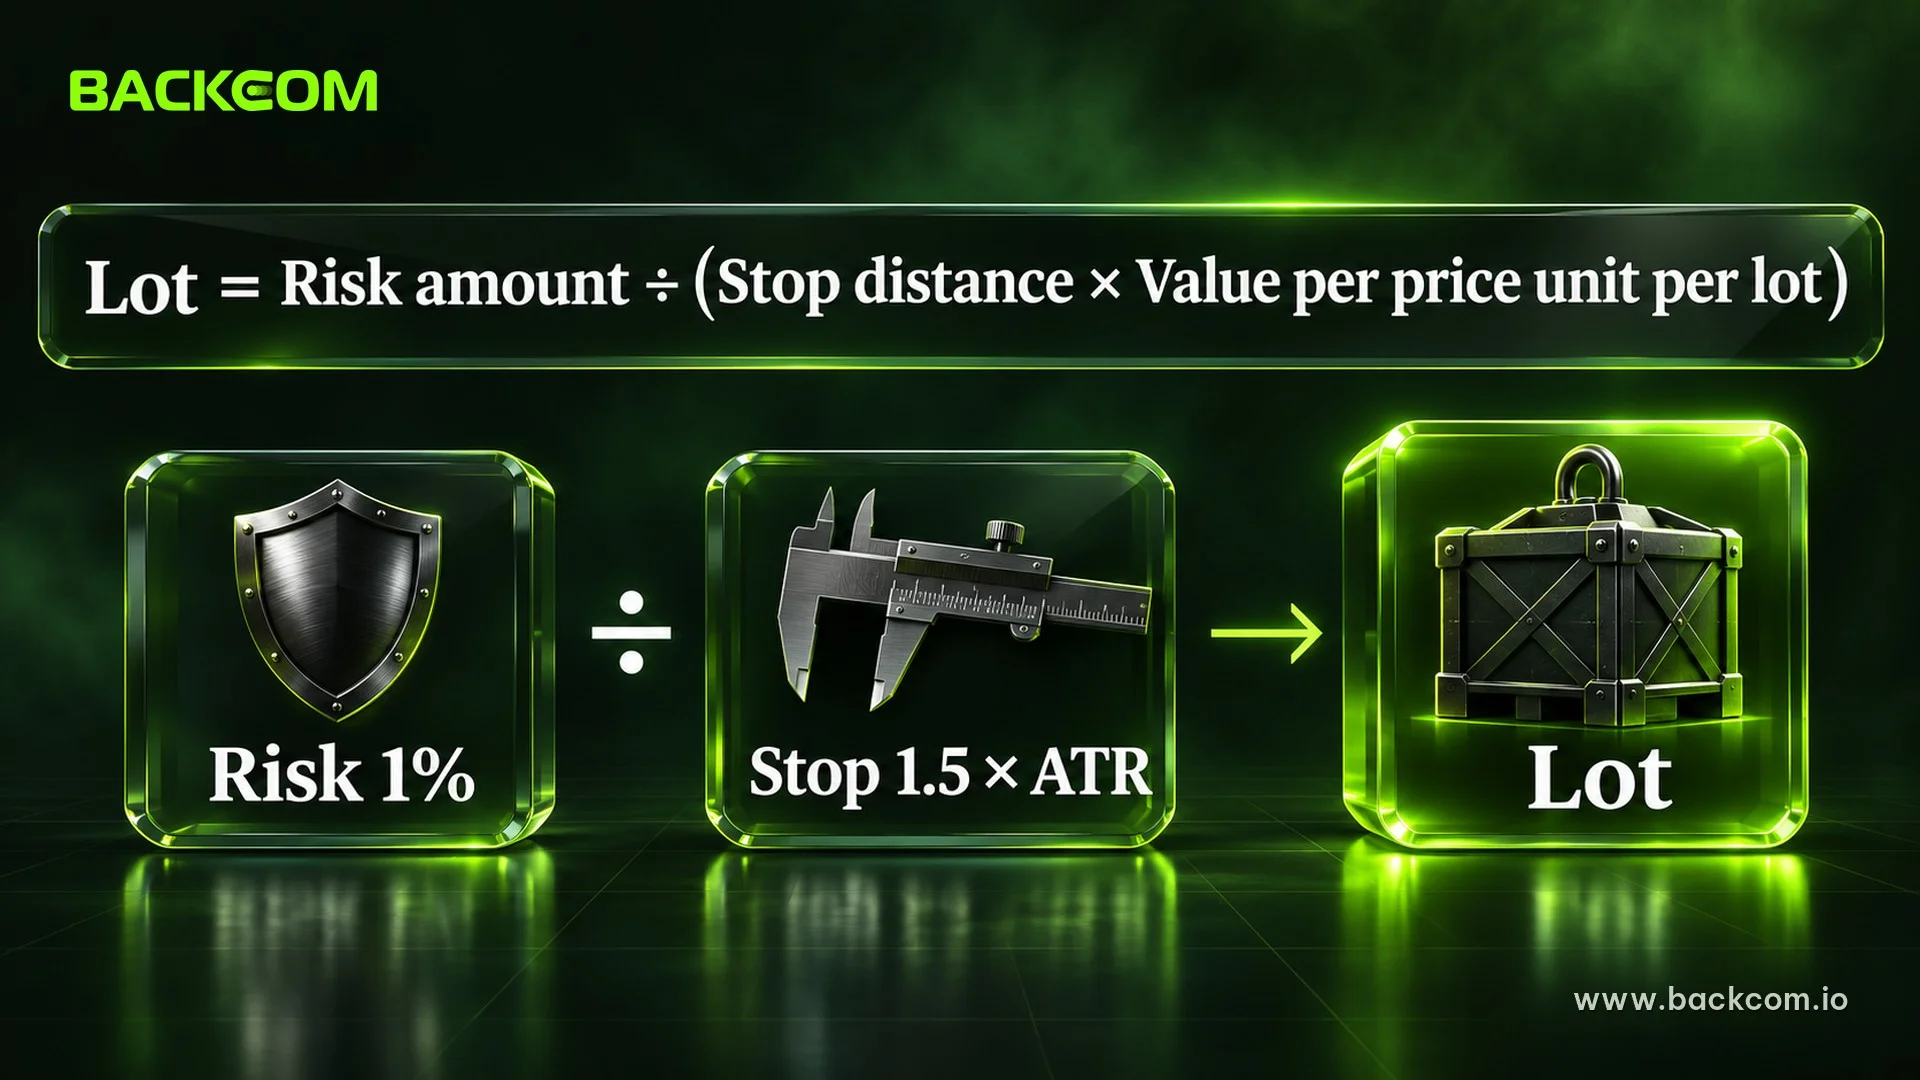
ATR position sizing means turning the stop distance into a volume so that the loss at the stop equals the risk amount you set. The wider the stop, the smaller the lot. The formula:
Lot size = Risk amount ÷ (Stop distance × Value per price unit of 1 lot)
The article on money management and the 1% rule covers the full rule. The two examples below use ATR from 6 November 2026, a hypothetical 5,000-dollar account and 1% risk, which is 50 dollars per trade.
EUR/USD Example
The daily ATR 14 of EUR/USD on 6 November 2026 is 0.00631, or about 63.1 pips. A multiplier of 1.5 gives a stop distance of 94.7 pips. One pip on 1 lot of EUR/USD is 10 dollars for a USD account, as in the guide on what a pip is and how to value it.
- Lot size = 50 ÷ (94.7 × 10) = 0.053, rounded down to 0.05 lot.
- Maximum loss at the stop = 0.05 × 94.7 × 10 = 47.35 dollars, below the 50 dollars planned.
Gold Example
The daily ATR 14 of gold on the same day is 86.60 dollars per ounce, so a multiplier of 1.5 gives a stop distance of 129.90 dollars. Most brokers define 1 lot of gold as 100 ounces, so each 1-dollar move is 100 dollars per lot. You should check the contract specification at your own broker.
- Lot size = 50 ÷ (129.90 × 100) = 0.0038, below the 0.01 minimum lot many brokers allow.
- If you still trade 0.01 lot, the loss at the stop is 129.90 dollars, which is 2.6% of a 5,000-dollar account.
- To keep risk at 1% with 0.01 lot and a 1.5 × ATR stop, the account would need about 12,990 dollars.
Note that spot gold (XAUUSD) at a broker differs slightly from the COMEX futures contract used in this article, so ATR on your platform will differ by a few units.
You do not have to calculate by hand each time, because the position size calculator from Backcom.io takes the stop distance and risk amount and returns the lot. What matters is the order: choose the stop first, then calculate the lot.
Limits Of ATR And 4 Common Mistakes
ATR has limits because it is an average of the recent past. When the market changes state suddenly, ATR always arrives late. These four mistakes are the most common:
1. Treating ATR as a buy or sell signal. ATR has no direction. Traders need another method to pick buy or sell, for example reading MACD or RSI to judge momentum.
2. Using ATR from the wrong timeframe. H1 ATR on gold is much smaller than daily ATR. If you hold a trade for several days using H1 ATR, the stop will almost certainly be hit.
3. Forgetting news and weekend gaps. ATR 14 dilutes one very large candle across 14 candles. On gold on 5 August 2026, True Range reached 206.60 dollars while the previous ATR was about 92.63. One session like that pushed ATR up to 100.77 and kept it high for many sessions afterwards.
4. Choosing the multiplier by feel. A multiplier of 1.5 to 3 is common practice among traders, not a rule from Wilder. You should test it on past data and a demo account before using it on a live trade.
An ATR stop also does not guarantee a fill at the exact level. A weekend gap or strong news can fill the order further away, and the broker's spread adds to the real distance, as the guide on what the forex spread is explains.
Frequently Asked Questions (FAQ) About ATR
What Is ATR 14?
ATR 14 is the ATR indicator calculated over the last 14 candles, with 14 being Wilder's default period. On the daily chart it is the average range of the last 14 sessions, gaps included. A shorter period gives a more sensitive line, and a longer period gives a smoother one.
What ATR Value Is Considered High?
There is no universal threshold, because ATR depends on the price units of each instrument. The practical approach is to compare current ATR with that instrument's own history. For example, gold had an ATR 14 of 112.55 in September 2026 and 75.41 in late October, so 112 was high for that period.
Should You Use ATR To Enter Trades Or Only For Stops?
ATR gives no entry signal because it has no direction. Traders usually use it for three jobs: checking whether a stop is too tight, sizing the lot from the stop distance, and noticing whether the market is compressing or expanding. The entry still needs a separate method.
How Is ATR Different From Bollinger Bands?
Both measure volatility but in different ways. ATR uses each candle's high-low range and gaps, while Bollinger Bands use the standard deviation of closing prices. ATR gives one distance figure that is handy for placing a stop, whereas Bollinger Bands draw a band around price.
Conclusion: What Is The ATR Indicator And How To Use It Properly
The ATR indicator comes down to three ideas: it is a smoothed average of True Range, it measures the width of movement and not direction, and it is expressed in the price units of each instrument. Traders need to look at three things together: ATR on the right timeframe, the multiplier, and the risk amount per trade.
A good next step is to open the chart you already use, add ATR 14, note the current value, and try calculating the stop distance and lot for one hypothetical trade. When you are ready to go further, read the guide on lot size in forex to be sure of volume before applying ATR to a live trade.
Disclaimer: This content is compiled by Backcom.io for information and reference only and is not investment advice, a trading recommendation or financial advice. Figures and examples are past prices and do not guarantee future results. Trading forex and gold carries a high level of risk and traders can lose their entire capital.
Was this article helpful?
Join The Backcom.io Community
Get the latest on trading rebates, trading tips, and broker deals — and connect with thousands of traders worldwide.

Backcom App
Track Your Rebates Every Day
Every rebate is visible by broker and by day. Manage your wallet and withdrawals in one place.
Open Backcom App