Ichimoku Cloud Explained: How To Read The Kumo, Tenkan-Kijun Crosses And Signals

Open a chart with Ichimoku on it and most traders see a red and green cloud, four crossing lines, and a reason to close the window. The question of what is Ichimoku actually has a short answer: it is a five-line system that reads trend, momentum and support or resistance using only the highest high, the lowest low and the close.
The hard part is not the formula. It is how to read Ichimoku without treating every line that crosses another as an entry signal, especially around the cloud and the crossovers.
In this article, Backcom.io walks through the system step by step, with real numbers from the gold chart:
- What Ichimoku is, who built it and which five lines it contains.
- How each line is calculated with the 9-26-52 settings, including a hand calculation for 30 September 2026.
- Ichimoku cloud explained: what the Kumo is and how to read it, with one hit and one miss.
- What a Tenkan-sen and Kijun-sen crossover tells you, and how often 15 crosses on gold were right.
- How to add Ichimoku in MT5 and the limits worth knowing.
What Is Ichimoku? The Five-Line System Of Goichi Hosoda
What is Ichimoku? Ichimoku Kinko Hyo is an indicator system made of five lines, two of which form a shaded cloud (the Kumo). It is used to judge trend, momentum and support or resistance on a single price chart. The name is usually translated as an "equilibrium chart at a glance", because the idea was to read the whole picture without stacking several separate indicators.
According to Wikipedia's overview, the system was developed by the Japanese journalist Goichi Hosoda from the late 1930s and released to the public in the late 1960s. StockCharts' guide dates the release to a book published in 1969. Both are secondary sources, because no original text by Hosoda could be checked for this article.
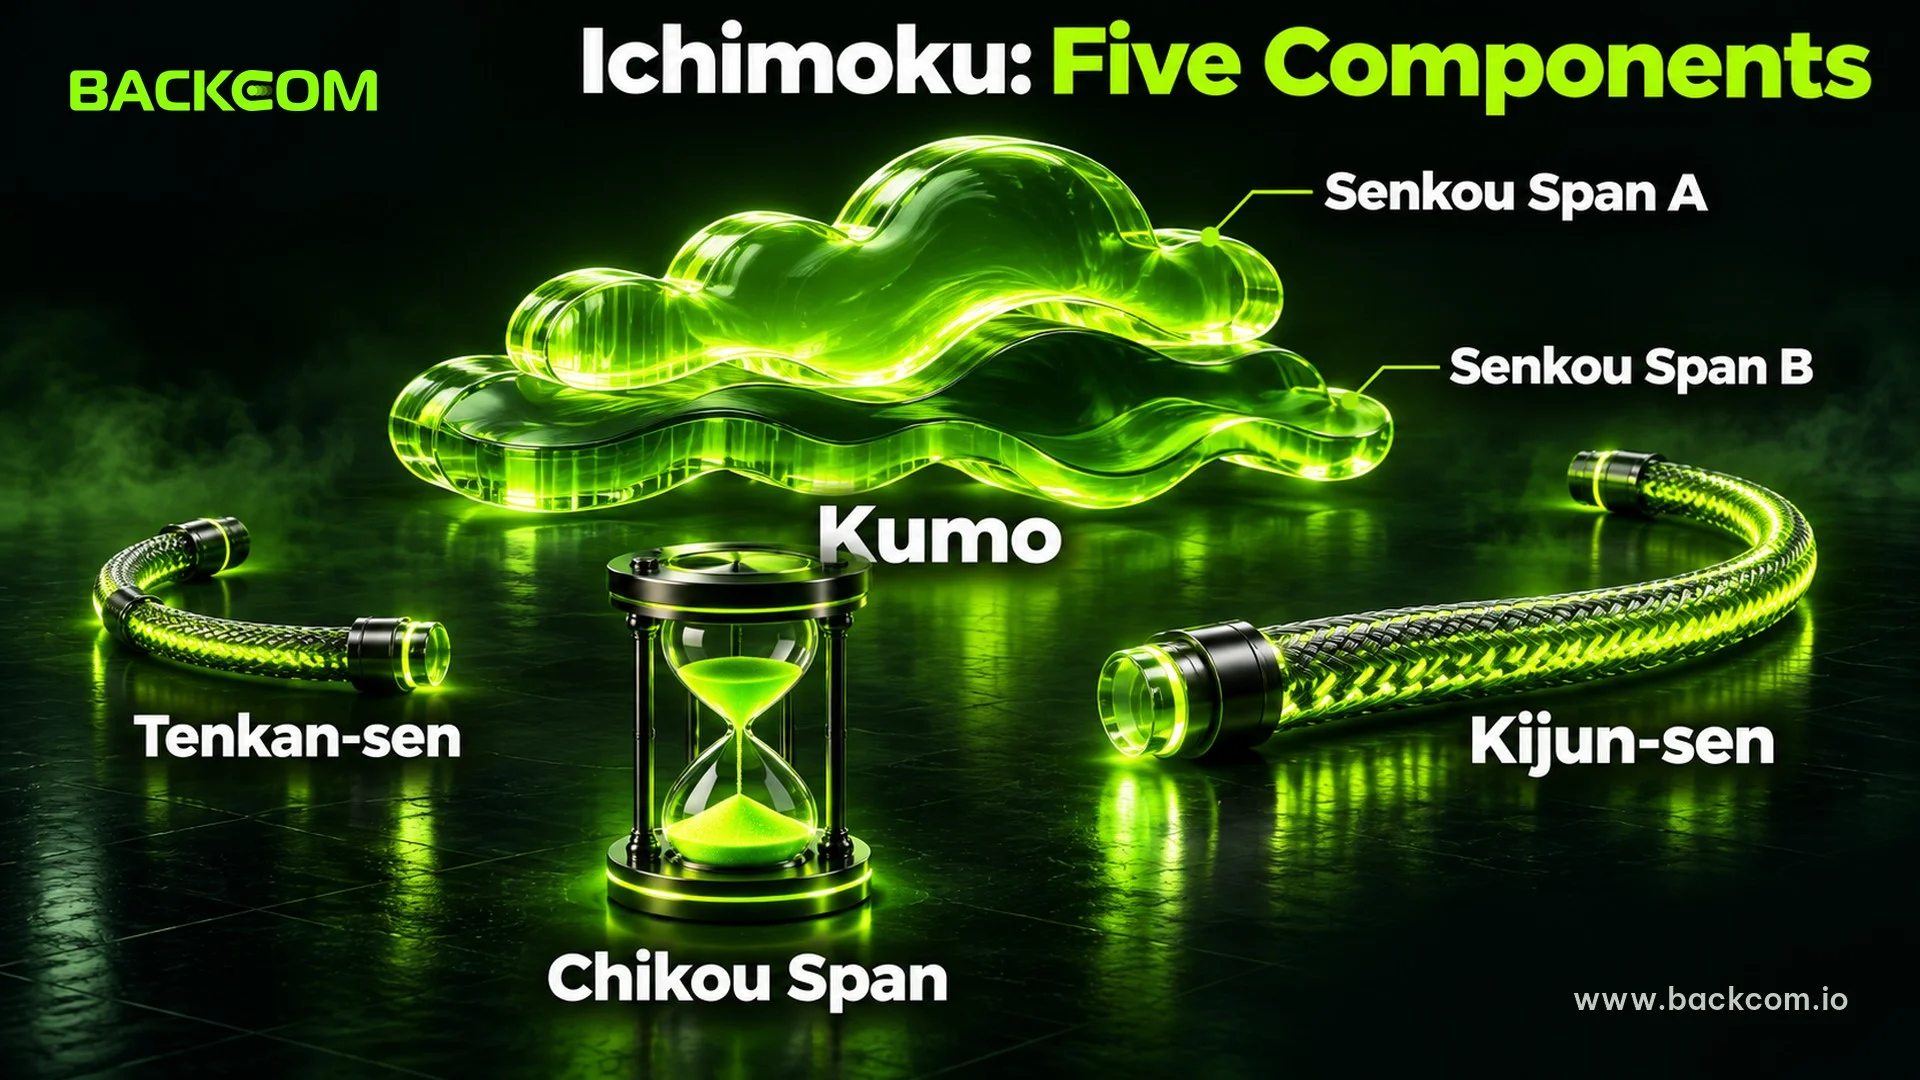
The five lines are:
- Tenkan-sen (conversion line): the fast line, measuring the short-term range over 9 candles.
- Kijun-sen (base line): the slower line, measuring the medium-term range over 26 candles.
- Senkou Span A: the average of Tenkan-sen and Kijun-sen, plotted 26 candles ahead.
- Senkou Span B: the midpoint of the last 52 candles, also plotted 26 candles ahead.
- Chikou Span (lagging line): today's close, plotted 26 candles back.
The area between Senkou Span A and B is shaded as the Kumo cloud. The big difference from indicators such as MACD is that Ichimoku draws part of the future, so traders can see where the cloud will sit over the next 26 candles. If you are new to the market, read what forex is first.
The numbers 9, 26 and 52 have a history of their own. Wikipedia explains 9 as roughly a week and a half of the six-day working week of that era, 26 as the average number of working days in a month and 52 as two months, but Wikipedia itself gives no source for that explanation. Traders should treat the set as a historical convention, not a verified constant.
How To Calculate The Five Ichimoku Lines With The 9-26-52 Settings
Ichimoku calculation only needs a highest high, a lowest low and a midpoint. There is no moving average or standard deviation involved, so every line can be checked by hand.
The first two lines are the midpoint of the price range over a window of candles:
Tenkan-sen = (Highest high of 9 candles + Lowest low of 9 candles) ÷ 2
Kijun-sen = (Highest high of 26 candles + Lowest low of 26 candles) ÷ 2
The cloud and the lagging line are built from them:
Senkou Span A = (Tenkan-sen + Kijun-sen) ÷ 2, plotted 26 candles ahead
Senkou Span B = (Highest high of 52 candles + Lowest low of 52 candles) ÷ 2, plotted 26 candles ahead
Chikou Span = Current close, plotted 26 candles back
These formulas match the descriptions from StockCharts and Wikipedia. The 9, 26 and 52 are look-back lengths, while the second 26 is the displacement of the cloud and the lagging line. Traders often confuse the two.
Worked Example On The Gold Candle Of 30 September 2026
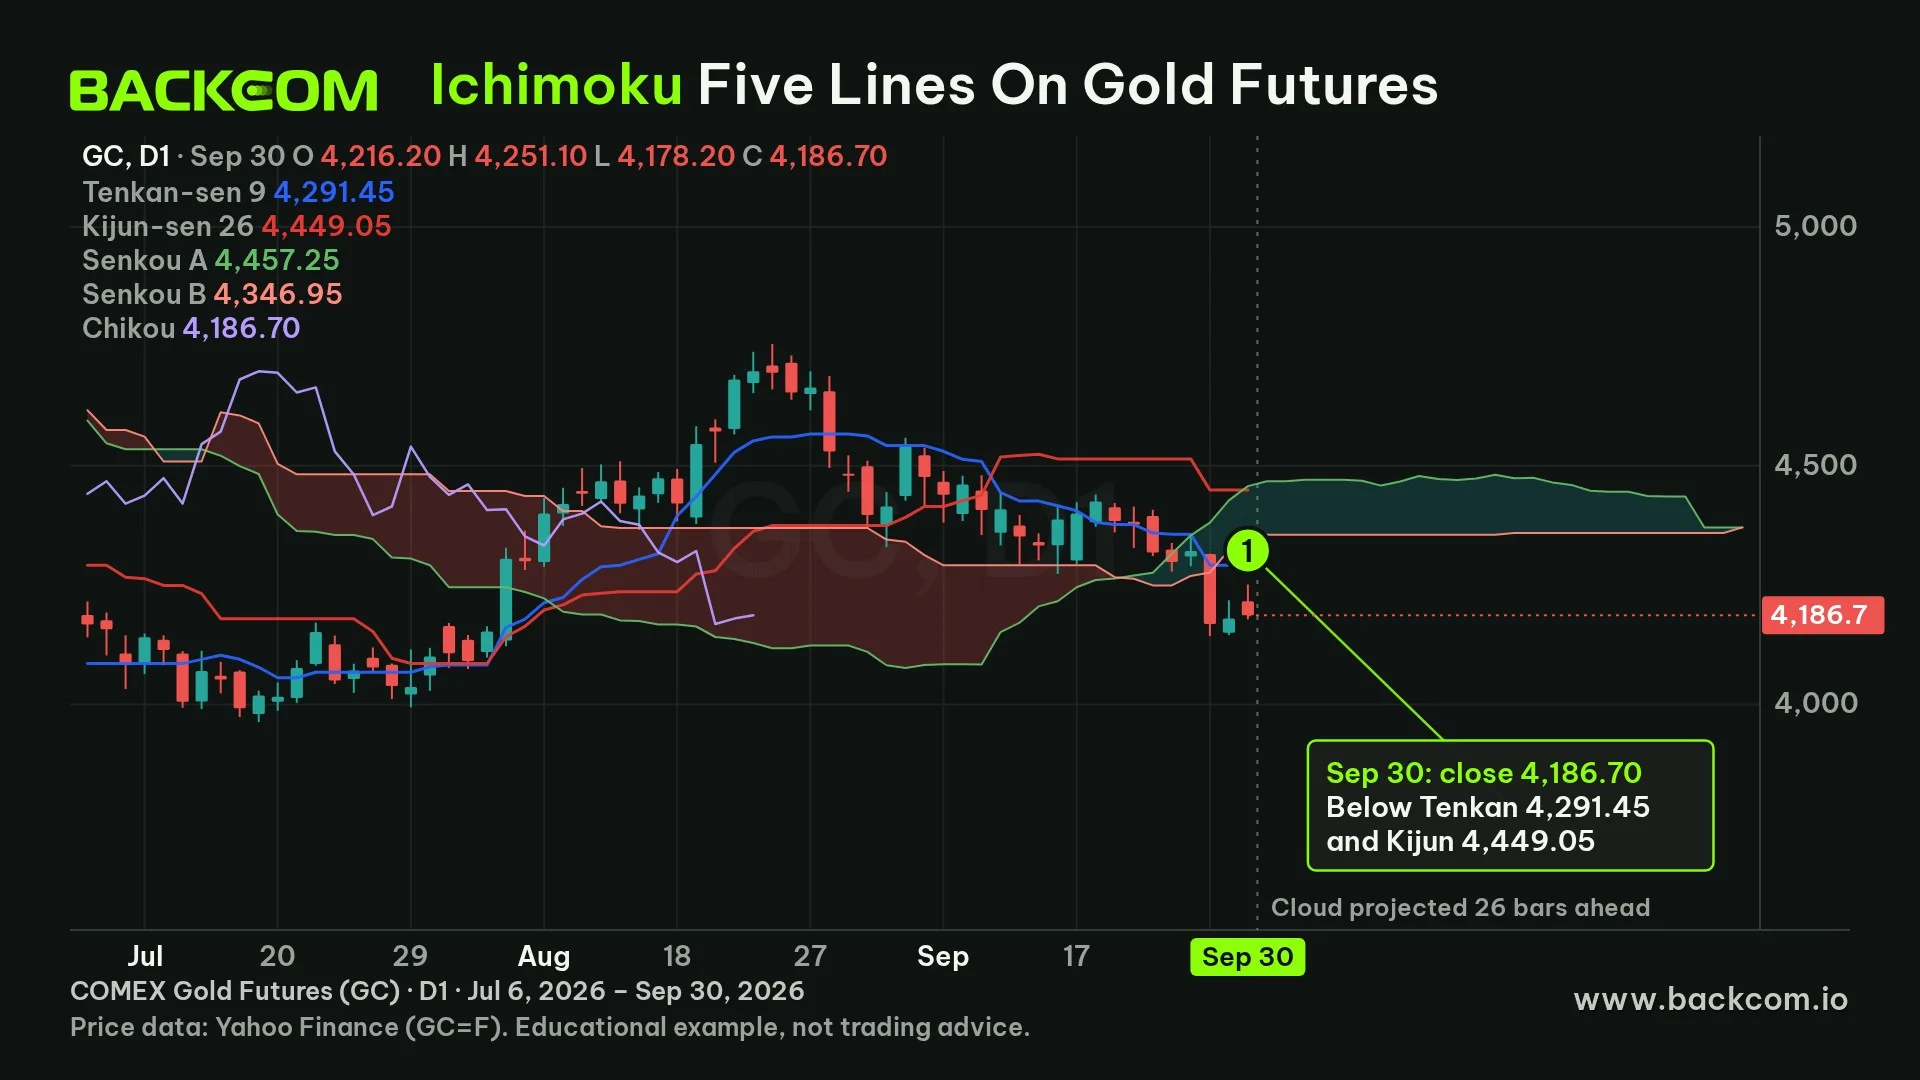
To see each step, take the daily candle of COMEX gold futures (GC) on 30 September 2026, with a close of 4,186.70 USD. The figures below come from real price data and were rechecked by hand.
| Line | Highest high | Lowest low | Result |
|---|---|---|---|
| Tenkan-sen (9 candles) | 4,439.80 | 4,143.10 | 4,291.45 |
| Kijun-sen (26 candles) | 4,755.00 | 4,143.10 | 4,449.05 |
| Senkou Span A | — | — | (4,291.45 + 4,449.05) ÷ 2 = 4,370.25 |
| Senkou Span B (52 candles) | 4,755.00 | 3,986.50 | 4,370.75 |
Data: daily GC=F candles from Yahoo Finance, retrieved on 4 November 2026, calculated with the standard Ichimoku formulas. These are past prices, not a recommendation to trade.
The close of 4,186.70 sits below both Tenkan-sen (4,291.45) and Kijun-sen (4,449.05). The Senkou values of 4,370.25 and 4,370.75 will be drawn 26 candles after this date, so the future cloud at that point is almost paper-thin, with the two lines only 0.50 apart.
On the chart, the legend shows Senkou A and Senkou B at 4,457.25 and 4,346.95. That is the part of the cloud currently sitting under the 30 September candle, calculated from 26 candles earlier, not the two numbers in the table. It is a common point of confusion when a chart is compared with a hand calculation.
Gold on Yahoo is the COMEX futures contract, so prices differ slightly from XAUUSD at a broker. A trader on MT5 may see slightly different numbers, but the method is the same.
Ichimoku Cloud Explained: What The Kumo Is And How To Read It
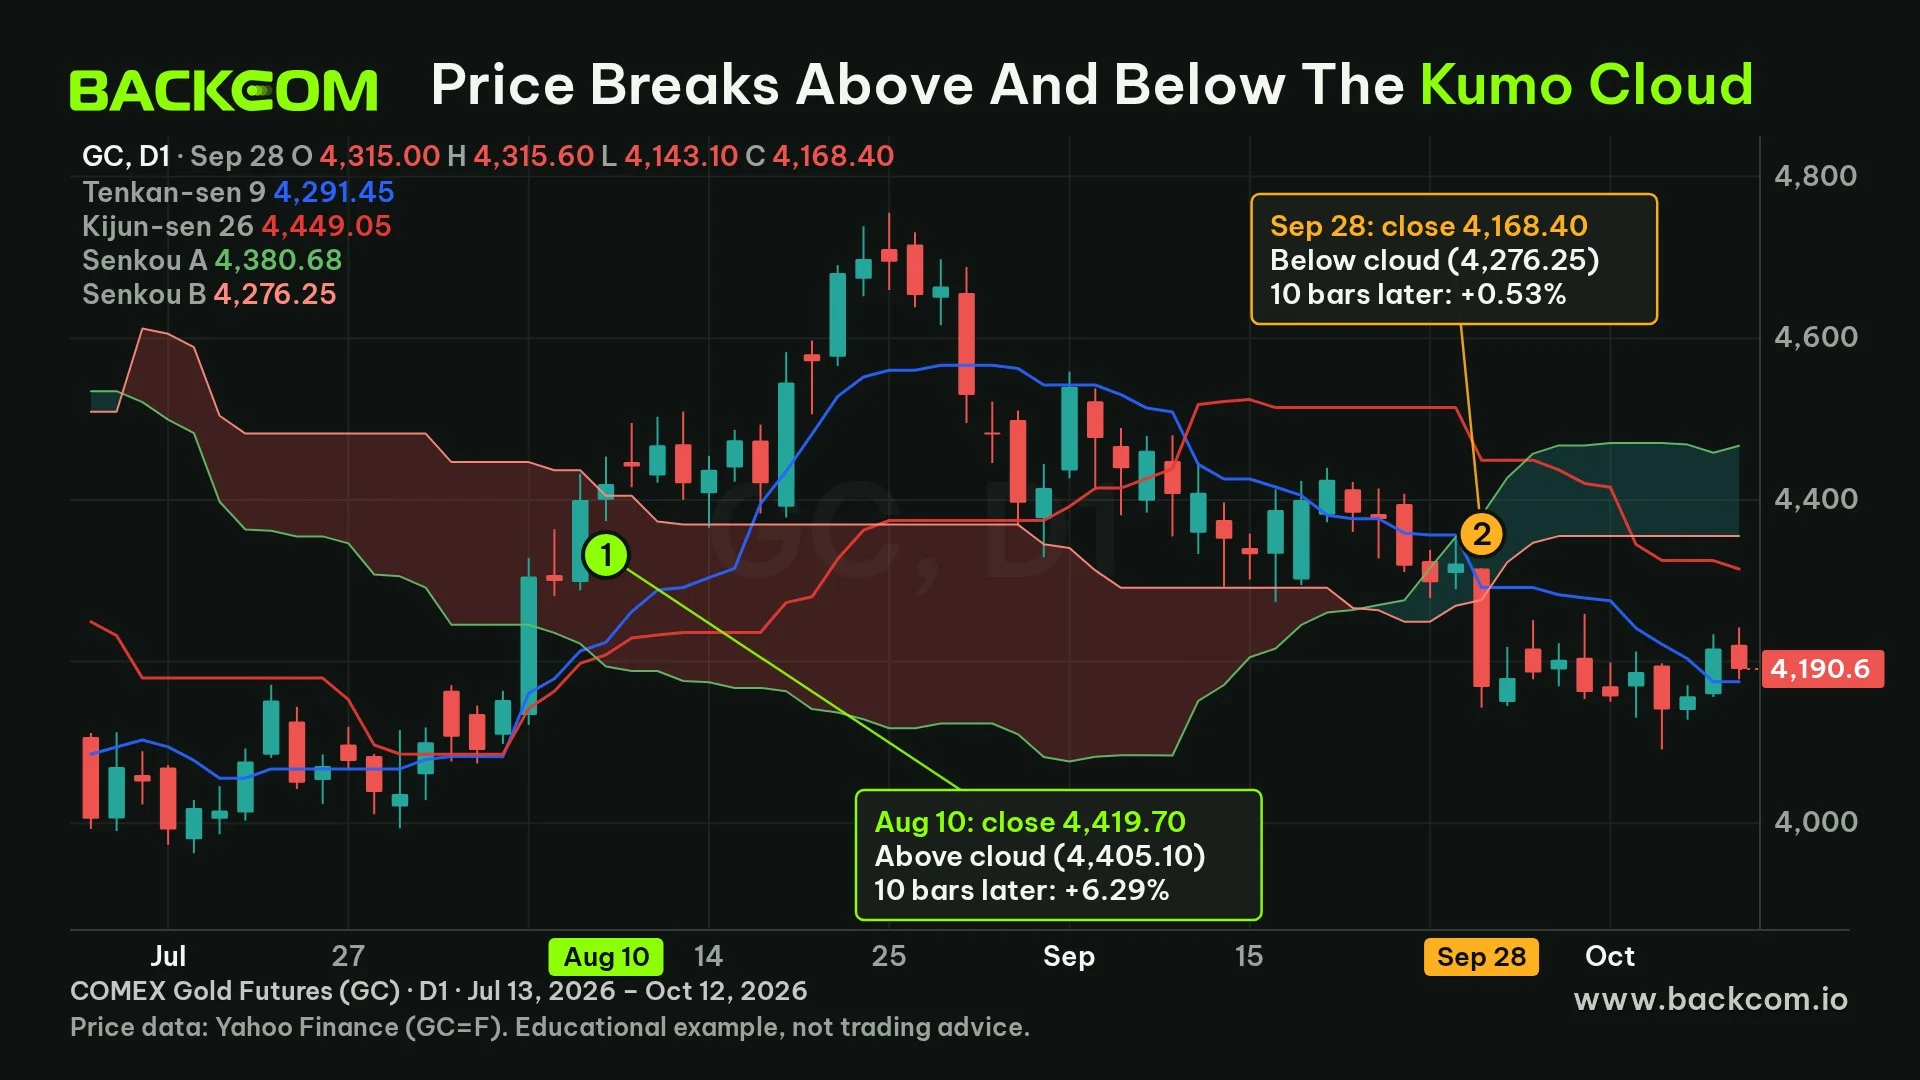
The Kumo cloud is the zone between Senkou Span A and Senkou Span B. It acts as support when price is above it and as resistance when price is below it. Because it is shifted 26 candles ahead, traders see this zone before price reaches it.
According to StockCharts, price above the cloud signals an uptrend, price below it a downtrend and price inside it a flat trend. When Senkou Span A is above Senkou Span B the cloud is usually shaded green (bullish), and red when the order is reversed. That source does not discuss cloud thickness, so claims such as "a thick cloud holds better" need separate testing.
Traders usually read the cloud through four features:
- Price position: above, inside or below the cloud.
- Cloud colour: green when Span A is above Span B, red when it is below.
- The twist: the point where the two Senkou lines swap places, which many traders treat as a sign that the backdrop may change.
- Cloud thickness: many traders see a thin cloud as a weak zone, but the sources cited here do not cover it.
These features sound reasonable but are not laws, because all of them lag price. The cloud only summarises data from 26 and 52 candles ago and forecasts nothing new.
Two Cloud Breaks On Gold: One Worked, One Did Not
To test the rule "a close outside the cloud", the test scanned every daily GC candle from 1 June 2025 to 3 November 2026. The rule counts a candle that closes above the upper edge or below the lower edge of the cloud when the previous candle was not yet outside the cloud on that side, including a jump straight from below the cloud to above it. That produced 8 breaks, and price moved the right way after 10 candles in 4 of them.
Two examples on the same chart show both outcomes:
- 10 August 2026, close above the cloud: the close was 4,419.70 against an upper cloud edge of 4,405.10. Ten candles later the close was 4,697.80, a gain of 6.29%.
- 28 September 2026, close below the cloud: the close was 4,168.40 against a lower cloud edge of 4,276.25. Ten candles later the close was 4,190.60, a gain of 0.53%, against the bearish signal.
Data: daily GC=F candles from Yahoo Finance, retrieved on 4 November 2026, cloud calculated with Ichimoku 9-26-52. A sample of 8 breaks, 4 in the signalled direction after 10 candles. These are past prices, not a recommendation to trade.
A sample of 8 is far too small to establish a rule. It only shows that a cloud break has no automatic edge, and that traders need extra conditions, such as the Chikou Span or the Kijun-sen, before trusting it.
Tenkan Sen Kijun Sen Crosses: How To Read Them And Where They Fail
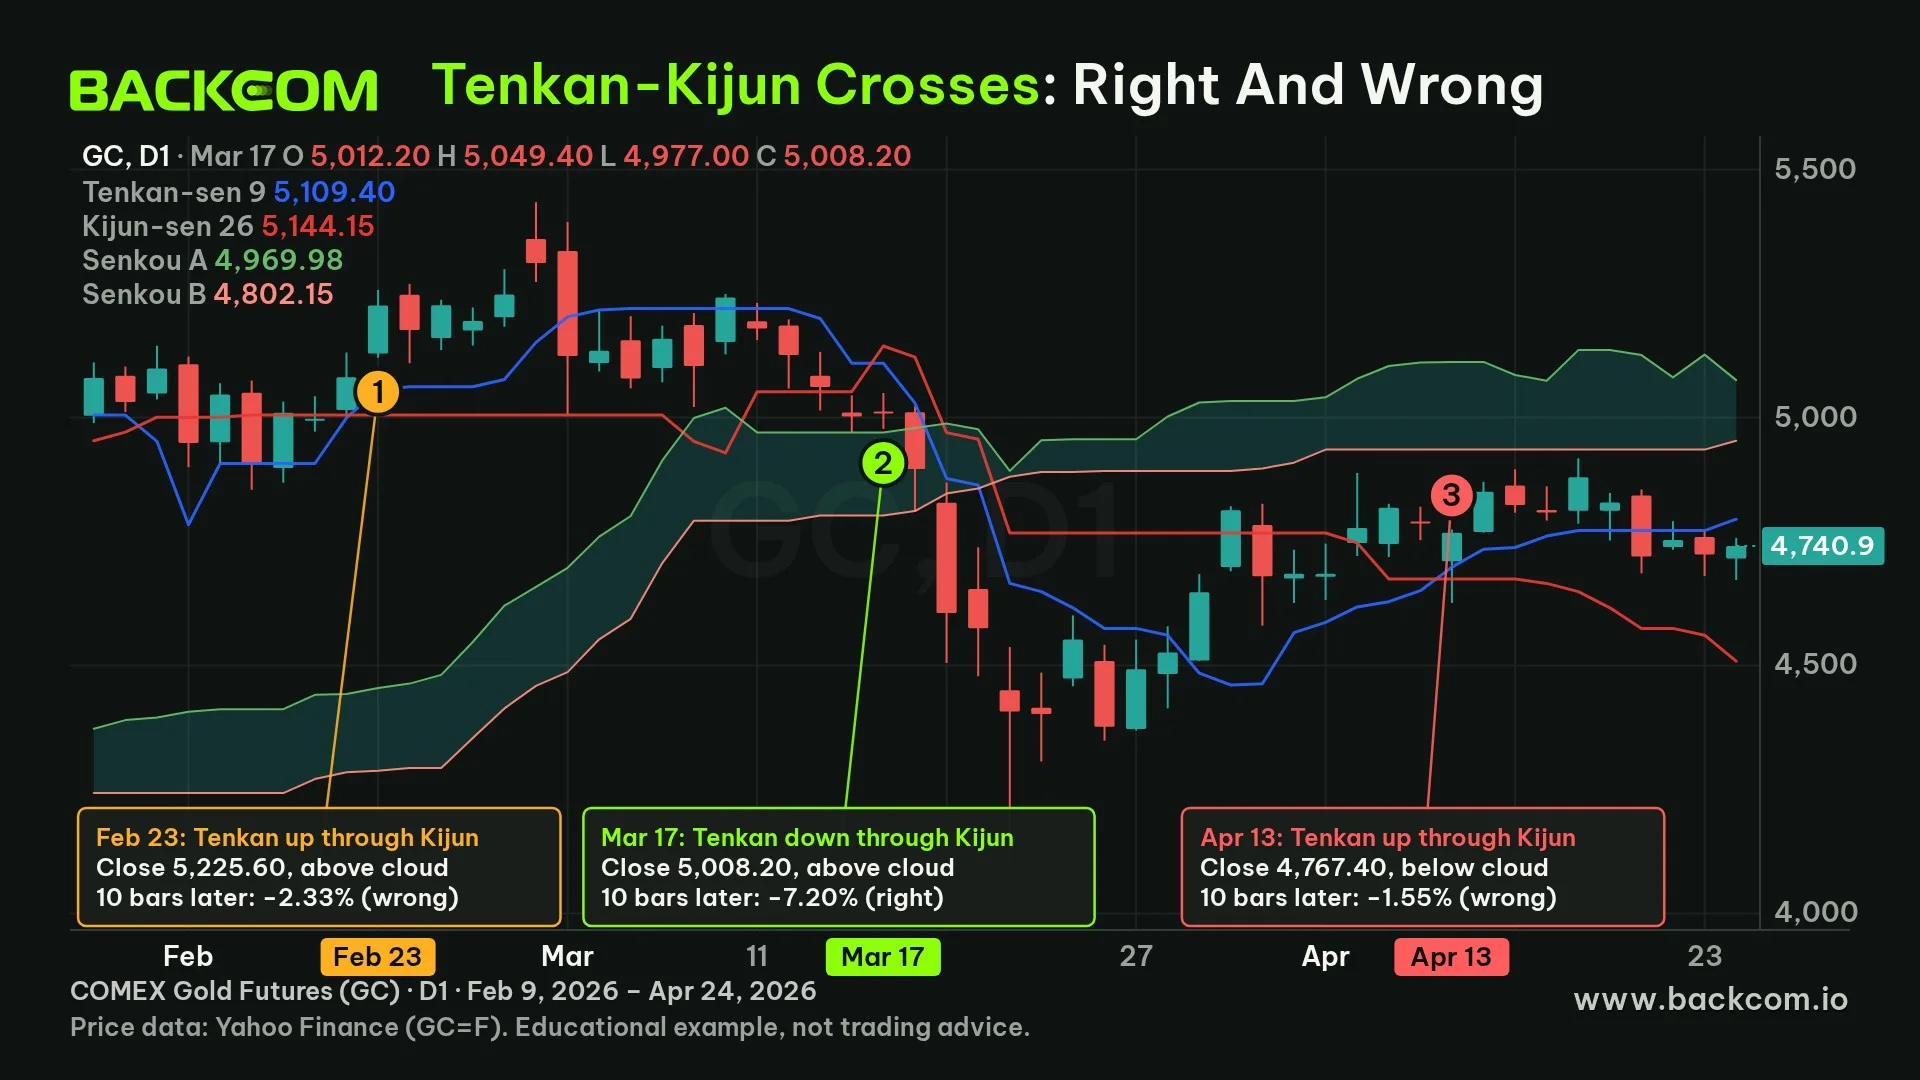
A Tenkan-sen and Kijun-sen cross is the classic Ichimoku signal, similar to the crossing of two moving averages in other indicators. When Tenkan-sen crosses above Kijun-sen traders read it as bullish, and a cross below as bearish.
According to StockCharts, a bullish cross is preferred when the bigger trend is up and a bearish cross when it is down, while signals against the existing trend are considered weaker. The same source notes that a cross can be rare while price is running hard, and offers price crossing the Kijun-sen as a more frequent alternative.
One point traders often miss is that Tenkan-sen and Kijun-sen are midpoints of a price range, not averages. They stay flat for long stretches until price sets a new high or low, and crosses in those stretches are often just noise.
How Often 15 Gold Crosses Were Right
The test also measured every Tenkan-sen and Kijun-sen cross on daily GC candles from 1 June 2025 to 3 November 2026, without filtering by cloud or trend. There were 15 crosses, and price moved the right way after 10 candles in 8 of them.
Split by cloud position, six crosses in the direction of the cloud (bullish above the cloud, bearish below it) were right 4 times. The other nine were right 4 times. The gap looks tempting, but the sample is too small to call "filter by the cloud" a secret.
Three crosses on the chart show the different situations:
- 23 February 2026, Tenkan crosses above Kijun with price above the cloud: the close was 5,225.60. Ten candles later the close was 2.33% lower, a wrong signal, and during those 10 candles price dipped 4.22% below that close.
- 17 March 2026, Tenkan crosses below Kijun: the close was 5,008.20, still above the cloud. Ten candles later price was down 7.20%, a right signal. During those 10 candles price fell as much as 18.13% below the close, while the furthest move against the signal was only 0.28% above it.
- 13 April 2026, Tenkan crosses above Kijun with price below the cloud: the close was 4,767.40. Ten candles later price was down 1.55%, a wrong signal, with a dip 2.00% below that close, and again a cross against the cloud.
Data: daily GC=F candles from Yahoo Finance, retrieved on 4 November 2026, results measured on the close 10 candles later. A sample of 15 crosses, 8 in the signalled direction. These are past prices, not a recommendation to trade.
So traders should treat a cross as something that needs confirmation, not as an order to enter. A common confirmation is where price has closed relative to the cloud and the Kijun-sen, followed by a stop placed on price structure, as covered in how to set a stop loss.
Chikou Span And How To Read Ichimoku With All Five Lines
The Chikou Span is today's close plotted 26 candles back, used to compare today's price with the price of 26 candles ago. If the line sits above the price of that time, traders read the upward momentum as intact, and the reverse for a line below.
The Chikou Span predicts nothing. It only confirms something that has already happened. On the 30 September 2026 chart, the Chikou value (the 4,186.70 close) is lower than the close 26 candles earlier, 4,697.80, which fits price sitting below both Tenkan-sen and Kijun-sen.
When all five lines are combined, a trader can run through a short checklist from the largest to the smallest:
- Price against the cloud: above, inside or below.
- Cloud colour and twist ahead: the backdrop for the next 26 candles.
- Price against the Kijun-sen: the medium-term trend.
- Tenkan-sen against Kijun-sen: short-term momentum, where the cross lives.
- Chikou Span against old price: the final confirmation.
When all five point the same way the picture is called aligned. But alignment only says the system agrees with itself, not that price will continue. Traders still need their own stop plan, in line with the rules in forex money management and lot size.
Ichimoku Strategy For Forex: Setting It Up In MT5, Timeframes And Limits
The most common Ichimoku strategy for forex sets the trend with the cloud and the Kijun-sen on a higher timeframe, then uses a Tenkan-sen cross or a support and resistance zone to pick the entry. This article does not give a fixed entry rulebook, because the numbers above do not prove any edge.
In MT5, Ichimoku Kinko Hyo is listed among the Trend indicators, and traders should enter 9, 26 and 52 if they want to match the standard set used here. The indicator also exists in MT4, and the differences between the two platforms are covered in MT4 vs MT5.
The limits worth remembering when using Ichimoku are:
- It lags: every line is built from 9, 26 or 52 candles that have already closed.
- Sideways markets: Tenkan-sen and Kijun-sen go flat and cross repeatedly, producing many false signals.
- Small timeframes: M1 and M5 candles are far noisier, and the 9-26-52 set was designed for daily charts.
- No universal best setting: Wikipedia mentions variants such as 10-30-60 and 20-60-120 for some markets, and StockCharts only says the parameters can be adjusted to a trading style. Nothing here tests those alternatives.
- Too many lines: the more lines on the chart, the easier it is to find "evidence" for what a trader already wants to believe.
A more practical route is to start on the D1 or H4 timeframe and log every Ichimoku signal and its result 10 candles later, the way this test did. A journal of a few dozen entries gives you real numbers for your own account. Traders still choosing a broker to run the chart can also look at the broker comparison page. Backcom.io is an independent introducing broker (IB/affiliate) of the brokers listed there; rebates are paid from the commission the broker pays Backcom.io, see the risk disclaimer.
Ichimoku also does not replace marking support and resistance from swing highs and lows. Fibonacci retracement is one popular way to cross-check a cloud zone.
Frequently Asked Questions (FAQ) About Ichimoku
What Is Ichimoku And Can It Be Used For Forex?
What is Ichimoku in one line: a five-line system built from the high, low and close, which works on any market with candlestick charts, including forex and gold. Nothing in this article shows that Ichimoku beats other indicators. Traders should test it on the daily timeframe first and record the results.
What Are The Default Ichimoku Settings?
The standard settings are 9, 26 and 52: 9 is the Tenkan-sen length, 26 is the Kijun-sen length and the cloud displacement, and 52 is the Senkou Span B length. That is the set used by StockCharts, while the pre-filled values on each platform should be checked on your own terminal. Changing to another set has not been broadly verified, so test it on past data first.
What Is The Difference Between A Green And A Red Ichimoku Cloud?
A green cloud appears when Senkou Span A is above Senkou Span B and is usually read as a bullish backdrop, while a red cloud is a bearish backdrop. Colour is not an entry signal. In the 8 cloud breaks on gold above, price moved the right way after 10 candles only 4 times.
Is A Tenkan Sen Kijun Sen Cross Reliable?
There is no general answer. On daily gold from June 2025 to November 2026, only 8 of 15 crosses moved the right way after 10 candles, close to a coin toss. Traders should pair a cross with confirmation such as price against the cloud and swing structure, and set a stop before entering.
Conclusion: Ichimoku Is A Context Map, Not A Signal Machine
What is Ichimoku comes down to three points: five lines built from the highest high, lowest low and close; a Kumo cloud drawn 26 candles ahead; and signals that all lag because they use data that has already printed. Traders should treat Ichimoku as a context map for trend, momentum and price zones to watch, not as a system that gives orders.
The gold data shows that both cloud breaks and line crosses were right only about half the time. A sensible approach is to log the results yourself on a daily chart, compare them with MACD, and keep only the conditions that genuinely improve your own results.
Disclaimer: This content is compiled by Backcom.io for information and reference only and is not investment advice, a trading recommendation or financial advice. The examples use past prices of COMEX gold futures, and past results do not guarantee future results. Trading forex and CFDs carries a risk of losing capital, and traders should make their own assessment.
Was this article helpful?
Join The Backcom.io Community
Get the latest on trading rebates, trading tips, and broker deals — and connect with thousands of traders worldwide.

Backcom App
Track Your Rebates Every Day
Every rebate is visible by broker and by day. Manage your wallet and withdrawals in one place.
Open Backcom App