MACD Indicator Explained: How To Read The MACD Line, Histogram And Divergence

Many traders open a chart, see two lines crossing above a row of rising and falling bars, and enter a trade only because "MACD just crossed up". A MACD indicator explained in one sentence sounds simple, but without knowing how those lines are built, it is easy to misread the signal, especially when price moves sideways.
In this article, Backcom.io will cover what traders most often ask about this indicator:
- What is MACD and how the MACD 12 26 9 settings are calculated, with a hypothetical worked example.
- How to read signal-line and zero-line crossovers.
- What the MACD histogram shows and why it turns before the lines cross.
- MACD divergence, an early signal that is easy to misread, and the limits that make the indicator lag.
What Is MACD? A Momentum Indicator Built From Two EMAs
What is MACD? MACD (Moving Average Convergence Divergence) is a momentum indicator that measures the gap between two exponential moving averages (EMAs) of the closing price. The gap widens when price moves quickly in one direction and narrows when the move slows down.
The key point is that MACD does not predict price. According to LuxAlgo's concept library, every component is built from lagged EMAs, so the indicator confirms a move that has already happened rather than warning about it in advance. Gerald Appel created it, although secondary sources do not agree on the exact year.
A MACD panel on the chart has three parts:
- The MACD line: the difference between a fast EMA and a slow EMA.
- The signal line: a smoothed EMA of the MACD line itself, which moves more slowly.
- The histogram: bars showing the distance between the MACD line and the signal line.
You should therefore treat MACD as a view of how fast a trend is moving, not as a machine that issues buy and sell orders.
How The MACD 12 26 9 Settings Are Calculated
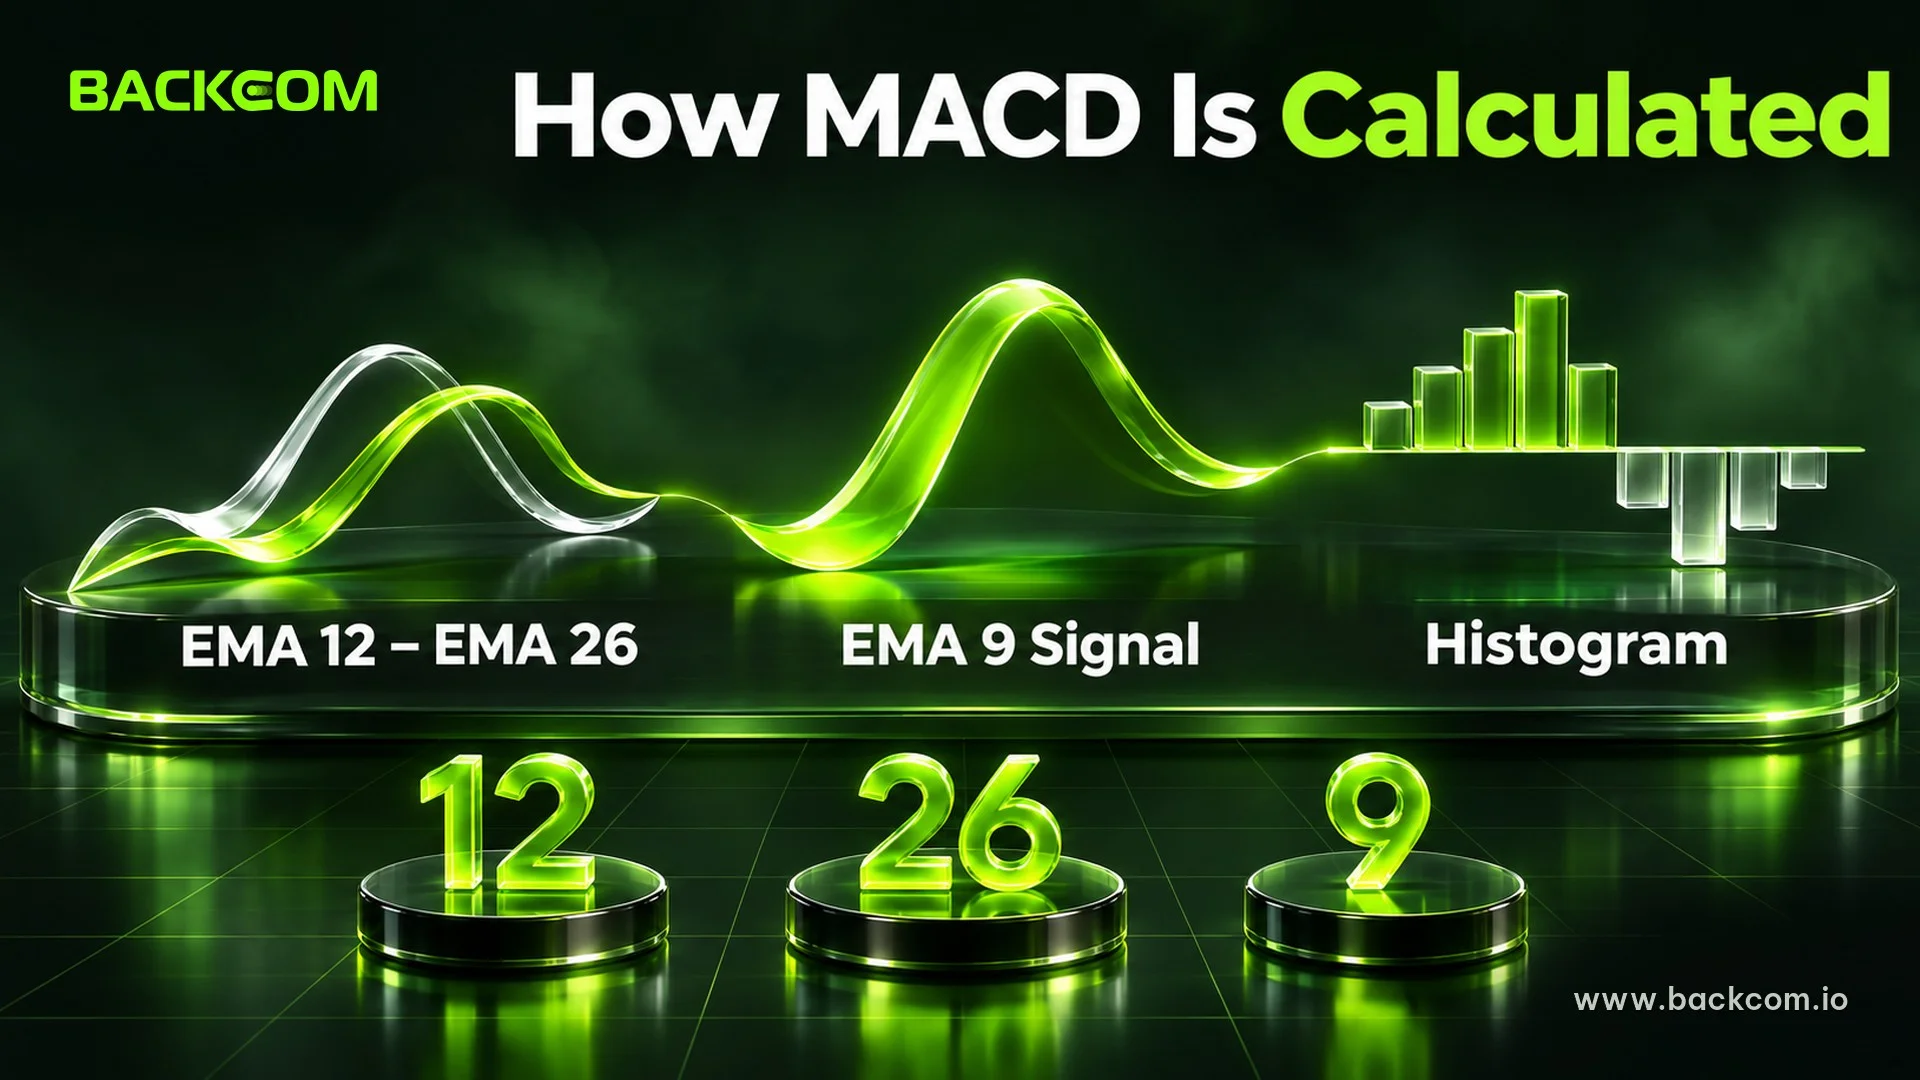
The MACD 12 26 9 settings are the default parameters: a 12-period EMA, a 26-period EMA and a 9-period EMA. The first number is the fast line, the second is the slow line, and the third is the length of the signal line.
The full calculation has three lines:
MACD line = EMA(12) of closing price − EMA(26) of closing price
Signal line = EMA(9) of (EMA(12) − EMA(26))
Histogram = MACD line − Signal line
Per LuxAlgo, 12, 26 and 9 are conventional defaults inherited from daily charts, not constants optimized for every market. Shorter periods make the indicator faster but add false signals.
A Hypothetical MACD Calculation
Each EMA uses a smoothing factor of 2 divided by (periods plus 1): the 12-period EMA uses 2 ÷ 13 ≈ 0.154, the 26-period EMA uses 2 ÷ 27 ≈ 0.074, and the 9-period EMA uses 2 ÷ 10 = 0.2.
Suppose that on an EUR/USD H1 candle the 12-period EMA is 1.0862, the 26-period EMA is 1.0840, and the signal line sits at 0.0015:
- MACD line: 1.0862 − 1.0840 = 0.0022, or 22 pips.
- Histogram: 0.0022 − 0.0015 = 0.0007, positive because the MACD line is above the signal line.
These numbers are hypothetical, used only to show the calculation as at 2 November 2026. They are not real market data and not a trade recommendation.
MACD values are measured in price units, so 0.0022 on EUR/USD cannot be compared directly with MACD on gold or an index.
How To Read The MACD Line: Signal Line And Zero Line
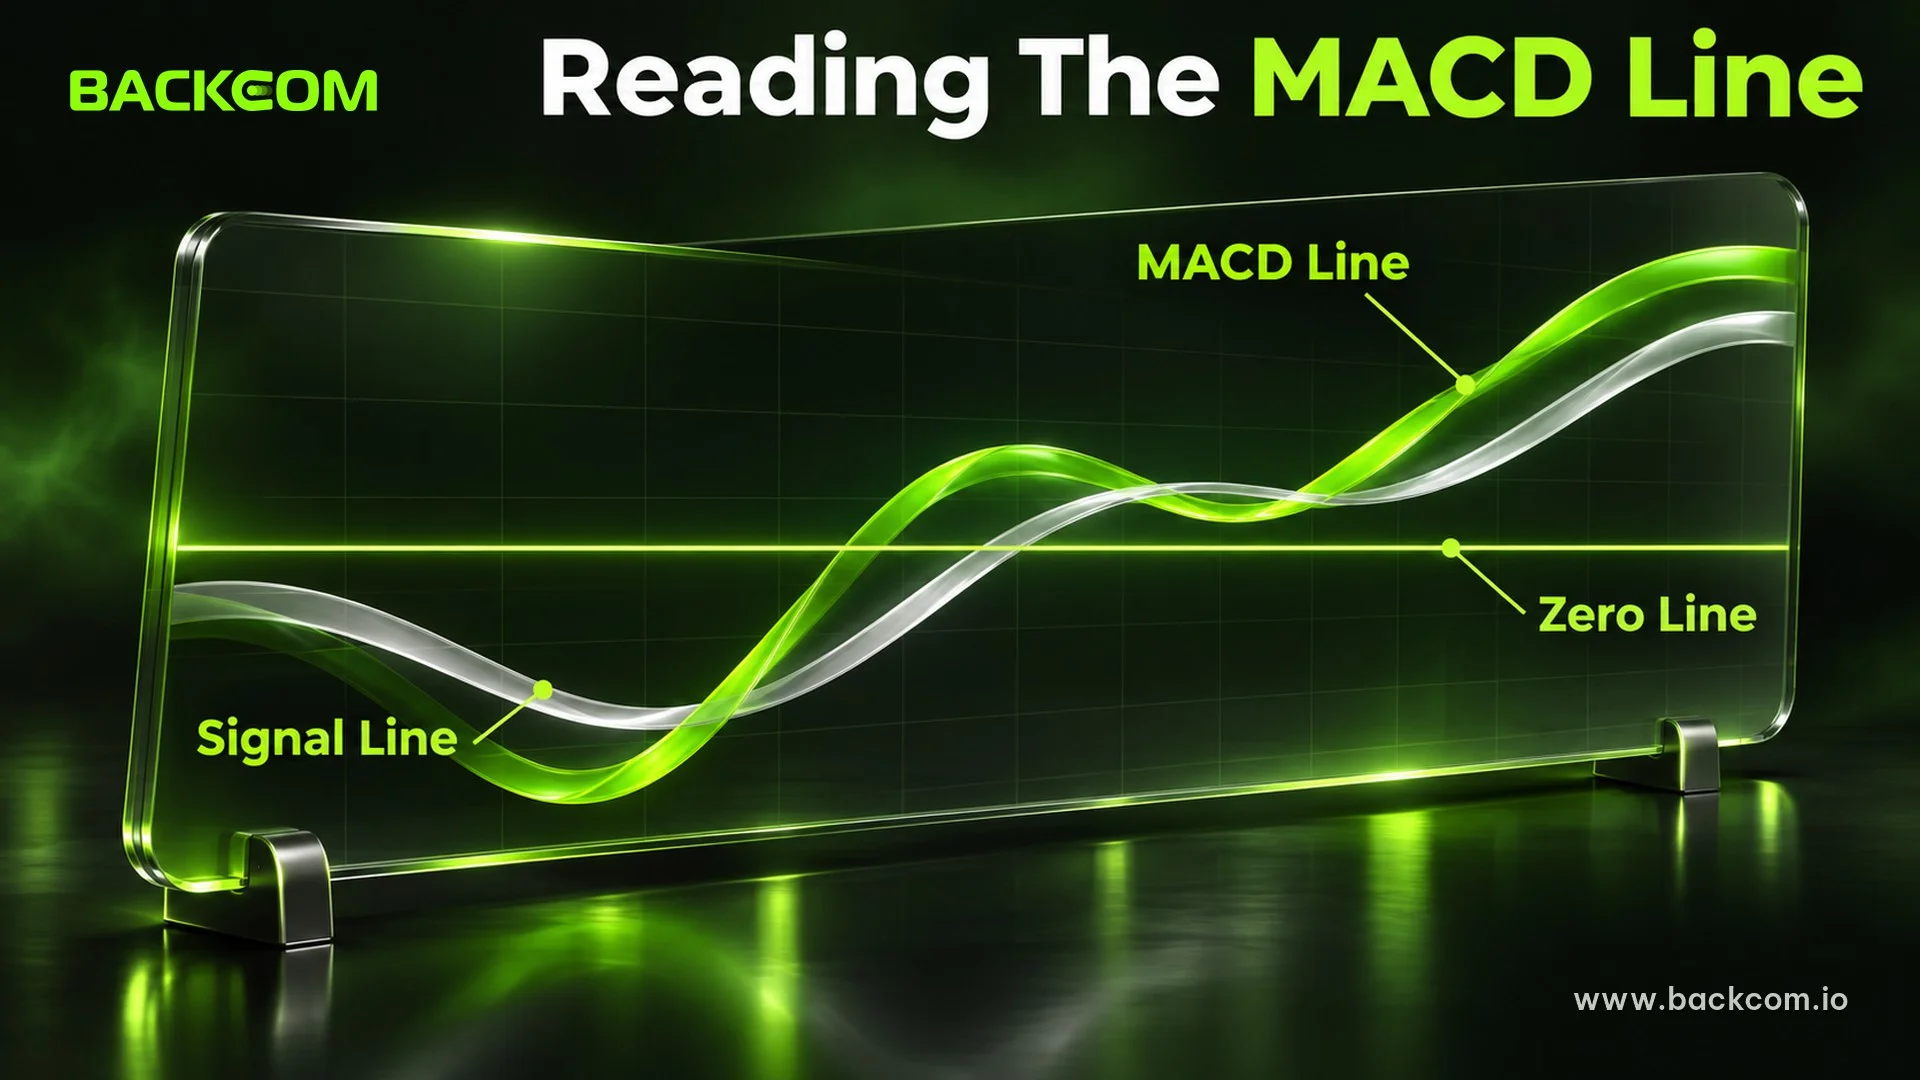
Reading the MACD line comes down to two kinds of crossover: the MACD line crossing the signal line, and the MACD line crossing zero. They differ in speed and in lag.
Signal-Line Crossover
When the MACD line crosses above the signal line, many traders read it as upward momentum returning. A cross below reads as downward momentum. According to Investing.com Academy, a crossover that agrees with the prevailing trend is generally treated as stronger confirmation.
However, a crossover only shows that momentum has turned relative to recent bars. It is not a standalone entry. LuxAlgo warns that raw crossovers whipsaw badly in a trading range, which is why many rules add a trend filter.
Zero-Line Crossover
A MACD line above zero means the 12-period EMA is above the 26-period EMA. Below zero means the opposite. A zero-line cross is therefore the same event as the two EMAs crossing.
This is the slowest MACD signal because it appears only after a trend has already travelled some distance. In return, it is less noisy than the signal-line cross.
| Signal | Condition | Speed | What to watch |
|---|---|---|---|
| Signal-line cross | MACD crosses its 9-period EMA | Fast | Many false signals in sideways markets |
| Zero-line cross | MACD changes sign, EMA 12 crosses EMA 26 | Slow | Often late in a fast move |
| Divergence | Price and MACD make mismatched highs or lows | Early | Needs confirmation and can last a long time |
Reference for reading MACD signals as at 2 November 2026, based on descriptions from LuxAlgo and Investing.com. Each signal has its own limits, so traders should test them on the pair and timeframe they actually trade.
What The MACD Histogram Tells You
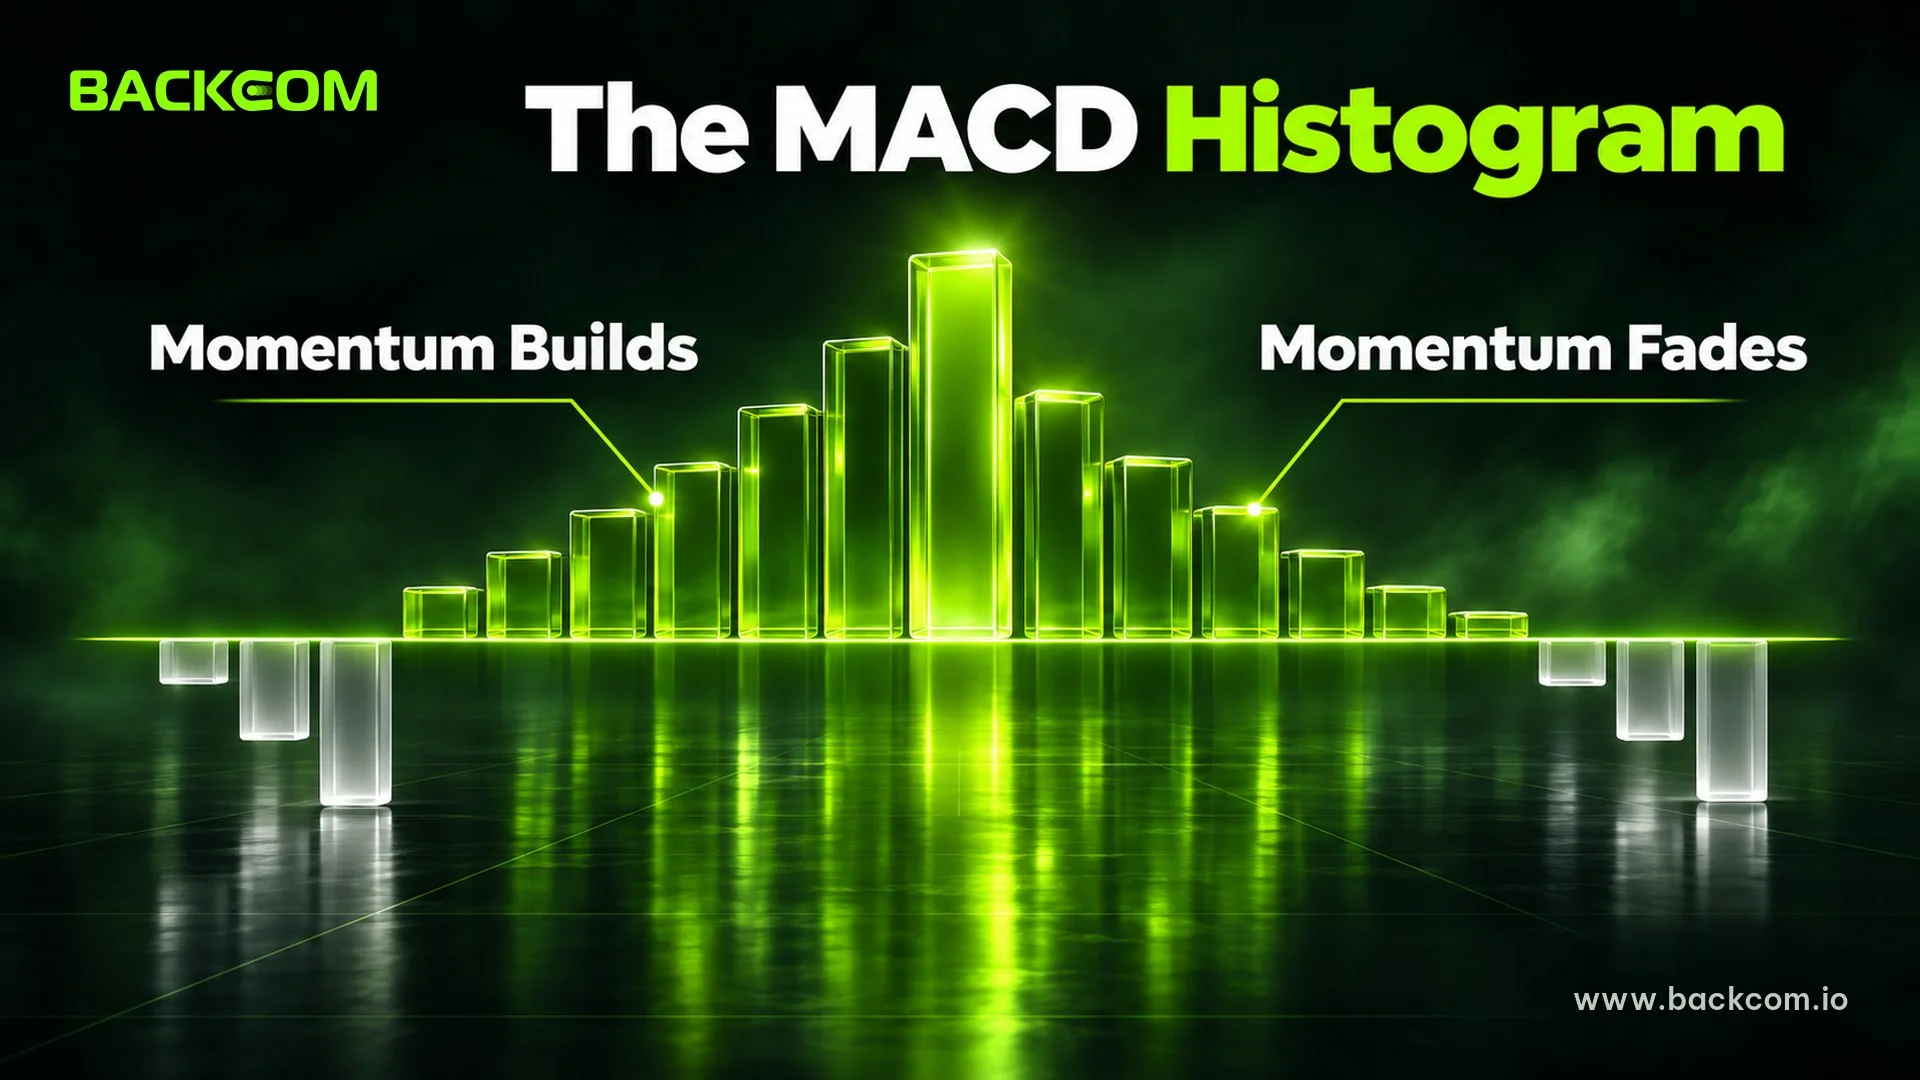
The MACD histogram is a series of bars measuring the distance between the MACD line and the signal line. Bars sit above zero when the MACD line is above the signal line, and below zero when it is below.
The histogram crosses zero at exactly the moment the two lines cross, as LuxAlgo describes. What it adds is the slope of the convergence. When the bars shrink toward zero, the gap between the lines is closing and a crossover may be near.
Traders usually read the histogram in three ways:
- Bars growing: momentum in the current direction is strengthening.
- Bars shrinking without changing sign: the move is losing energy, which may be a moment to review a stop loss or take partial profit.
- Bars changing sign: the lines have just crossed, equivalent to a signal-line crossover.
One caution: tall bars do not mean price will keep going. According to Investing.com, an extreme histogram reading often signals that momentum is slowing, after which the curve tends to revert toward its mean. The histogram adds information about speed, but it does not replace analysis of price structure.
MACD Divergence: An Early Signal That Is Easy To Misread
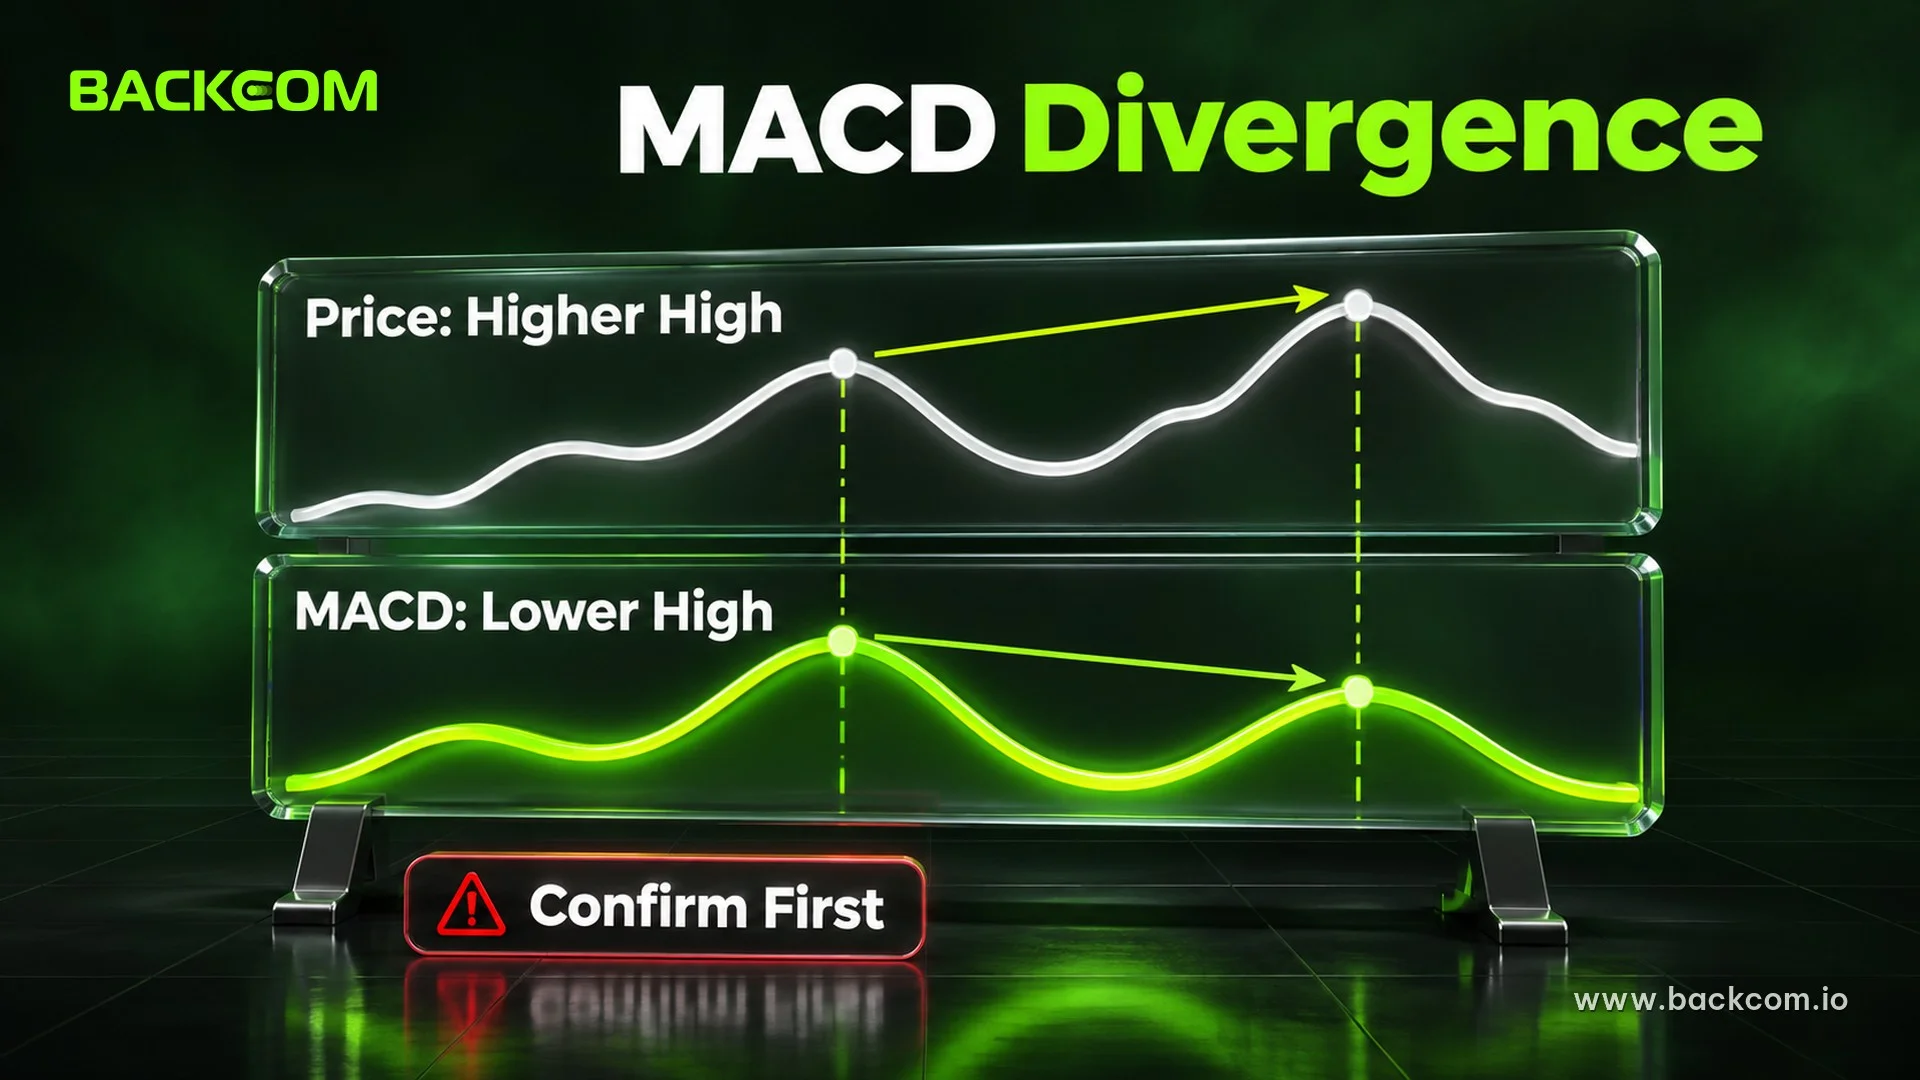
MACD divergence appears when price and the indicator tell different stories. LuxAlgo describes it as price making a new extreme while the MACD line or histogram makes a lesser one.
There are two basic forms:
- Bullish divergence: price makes a lower low while MACD makes a higher low. Selling pressure may be fading and an upward reversal is possible.
- Bearish divergence: price makes a higher high while MACD makes a lower high. Buying pressure may be fading and a downward reversal is possible.
This signal comes earlier than a crossover, but it is also the easiest to misread. Price can diverge several times and still continue the trend, especially when momentum is strong. Both sources above stress that divergence needs further confirmation before you act.
A careful routine for traders looks like this:
- Mark two clear highs or two clear lows on the same timeframe, rather than connecting small swings.
- Compare the price extremes with the MACD extremes at exactly those two moments.
- Wait for confirmation from price structure, such as a break of the nearest support or resistance zone.
- Place the invalidation point beyond the last price high or low.
Hypothetical example: EUR/USD makes a high at 1.0900 and then a high at 1.0925, but the second MACD peak is lower than the first. That is bearish divergence, and it only matters if price later closes through a nearby support zone.
How To Use MACD On MT5 Step By Step
Using MACD on MetaTrader 5 has two parts: adding the indicator to the chart, and deciding the filters you will use to read it. The second part matters much more than the first.
To add the indicator:
- Open the chart of the pair you want to follow in MT5.
- Go to Insert, choose Indicators, then Oscillators, and select MACD.
- Keep the defaults Fast EMA 12, Slow EMA 26, MACD SMA 9 and set Apply to: Close.
- Confirm, and the indicator appears in a sub-window below the price chart.
Note: the built-in MACD on MT5 draws the MACD line itself as bars, and its signal line is a 9-period SMA, so the bars cross zero when the EMA 12 crosses the EMA 26 rather than showing MACD minus signal line as above (per the mql5.com community, not verified against official documentation). If you are unsure how the two platforms differ, see MT4 vs MT5 differences.
After adding it, you should fix a clear reading rule before trading:
- Take only crossovers that agree with the larger trend: for example, only consider buys when price is above the 200 EMA.
- Ignore crossovers near the zero line when price is flat: this zone holds the most noise.
- Combine with price zones: a signal at support or resistance is more reliable than one in empty space.
- Test on a demo account and historical data: the default settings do not guarantee results.
Limits Of MACD And 4 Common Mistakes
MACD has three main limits according to the sources checked: it lags because it is built from EMAs, it gives false signals when price moves sideways, and its values cannot be compared across instruments. Investing.com also stresses that it cannot forecast every reversal.
Four mistakes traders often make with MACD:
- Entering the moment the lines cross: a crossover is only a necessary condition. Without a larger trend and a price zone, signals often fail.
- Using MACD in a flat market: constant crossovers produce a string of small losing trades while costs add up.
- Reading MACD as overbought or oversold: MACD has no fixed bounds like RSI, so "high" or "low" only means something against the instrument's own history.
- Optimizing settings until they fit the past: a parameter set that looks perfect on old data usually degrades when the market changes regime.
A common answer is to use MACD to gauge trend speed while basing entries on price structure and risk management. Before you click, you should size the trade with a position size calculator and keep a journal of every signal to see which ones actually worked.
MACD Signals And Trading Costs
MACD signals on small timeframes appear frequently, so trading costs become a factor you should not ignore. Every order pays the spread, and many accounts also charge commission.
A crossover strategy can produce dozens of trades a week, so even a small spread difference adds up. Part of that cost can be offset by a rebate paid on closed lots. A rebate does not make a wrong trade right and does not cover losing trades.
Backcom.io is an independent introducing broker (IB/affiliate) of its partner brokers; rebates are paid from the commission the broker pays Backcom.io, see the risk disclaimer. You can check current conditions and rebate levels on the list of partner brokers.
Frequently Asked Questions (FAQ) About MACD
Can MACD Predict A Reversal In Advance?
Not reliably. MACD is built from EMAs, so it lags price, and Investing.com states that it cannot forecast every reversal. Divergence gives an earlier signal than a crossover but still needs confirmation from price structure. You should treat MACD as supporting evidence, not the only reason to enter.
Which Timeframe Works Best For MACD?
There is no single best timeframe. The 12, 26, 9 settings were inherited from daily charts, and smaller timeframes tend to produce more false signals. You can test the same rule on H1, H4 and D1 with historical data, then choose the timeframe that matches how often you can watch the chart.
Is A Color Change In The MACD Histogram A Buy Or Sell Signal?
Not by itself. The MACD histogram changes sign exactly when the MACD line crosses the signal line, so it is just another view of the same crossover. Shrinking bars show a slowing move, but they are not a reversal order. Wait for further confirmation before acting.
Should You Change The MACD 12 26 9 Settings?
You can, but carefully. Shorter periods make the indicator faster and add false signals, while longer periods make it slower and less noisy. Test any change on a demo account and historical data, and avoid tuning the settings to fit one period only.
Conclusion: MACD Indicator Explained And How To Use It To Read Momentum
Understanding the MACD indicator comes down to three points: the MACD line is the difference between two EMAs, the signal line and histogram only clarify how fast that difference is changing, and every signal lags because it is built from past prices. Traders need to look at the larger trend, price zones and risk management together instead of waiting only for two lines to cross.
The next step is to add MACD 12, 26, 9 to a demo chart, record crossovers and divergences for a few weeks, and compare them with what price actually did. Once the rules are clear, you can size the trade with the position size calculator before risking real money, or browse more forex knowledge articles.
Disclaimer: This content is compiled by Backcom.io for information only and is not investment advice or a trading recommendation. Trading forex and CFDs is leveraged, carries high risk and can result in the loss of all capital. The numeric examples are hypothetical, technical indicators do not guarantee results, and you should verify everything yourself before placing a trade.
Was this article helpful?
Join The Backcom.io Community
Get the latest on trading rebates, trading tips, and broker deals — and connect with thousands of traders worldwide.

Backcom App
Track Your Rebates Every Day
Every rebate is visible by broker and by day. Manage your wallet and withdrawals in one place.
Open Backcom App