How To Draw Trendlines: 3 Steps To Draw, Confirm And Trade A Breakout


Most traders have drawn a line across a chart, watched price touch it a couple of times, entered on the next touch and been stopped out. The problem is rarely the tool. It is that the line joined two arbitrary points and never went through a single check.
How to draw trendlines properly comes down to a short routine: pick the right trend, join two real swing highs or swing lows, then wait for a third touch before trusting the line. After that, the skill is telling a genuine break from a one-candle stop run.
In this article, Backcom.io walks through the three drawing steps, the difference between an uptrend line and a downtrend line, how to confirm that a line is valid, and a trendline trading strategy built on breakouts. Every example uses real daily candles on gold and EUR/USD, with dates, prices and outcomes, including the one that failed.
What Is A Trendline? A Line Connecting Highs Or Lows In The Direction Of Price
A trendline is a straight line joining at least two swing highs or two swing lows on a price chart, used to show the direction and the slope of a trend. It differs from a horizontal support or resistance level because it slopes, so the price it represents changes with every candle.
There are two basic forms:
- Uptrend line: joins successive higher lows, sits below price and often acts as dynamic support.
- Downtrend line: joins successive lower highs, sits above price and often acts as dynamic resistance.
The important point is that a trendline describes how price has moved, not where it must go next. BabyPips also notes that two points are enough to draw a trend line, but a third is needed to confirm that the line matters.
A line only means something when the trend is visible. If price chops sideways and the highs and lows are messy, traders are better off skipping the drawing than forcing a line onto the chart.
Further reading: BabyPips guide to trend lines.
How To Draw Trendlines In 3 Steps: Pick The Trend, Join Two Points, Wait For The Third Touch
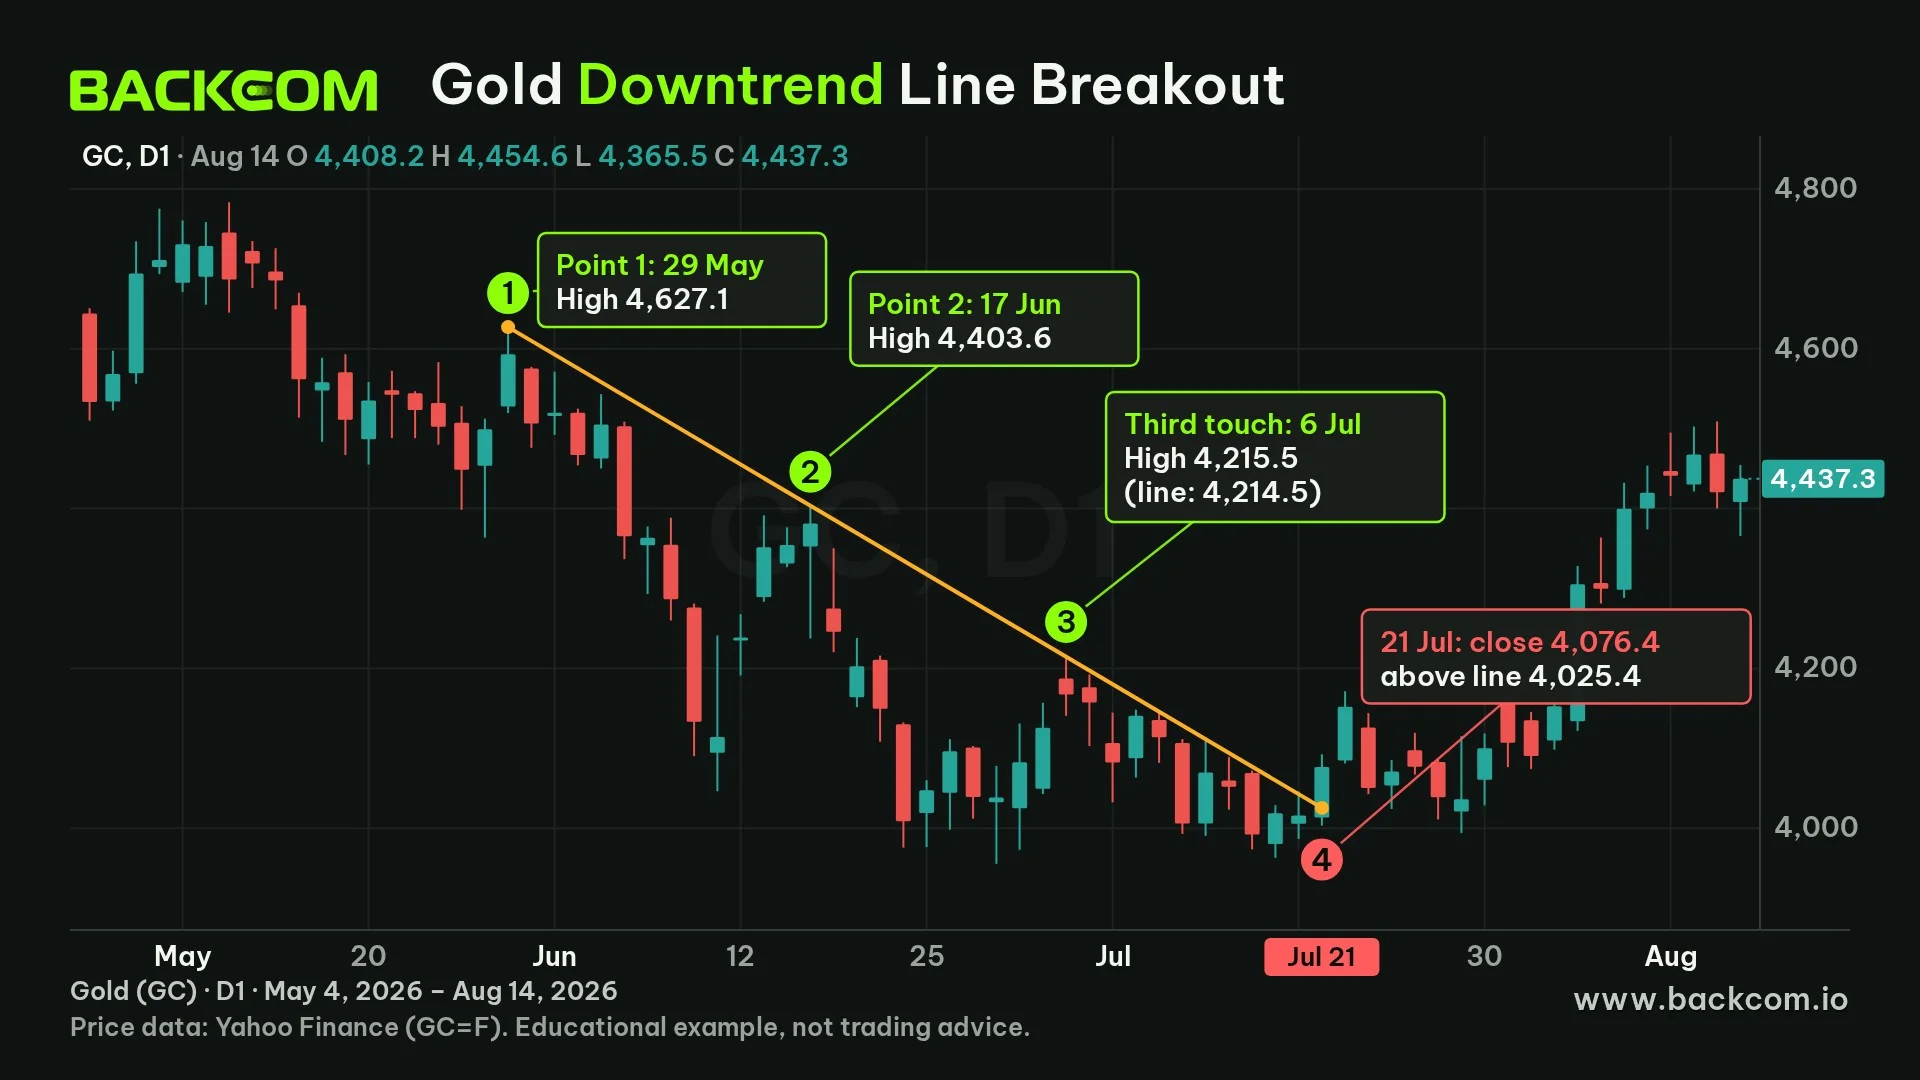
Drawing a trendline takes three steps in order. Skipping any of them makes the line likely to fail just as a trader starts to trust it.
Step 1: Choose the timeframe and identify the trend
Start on a higher timeframe such as D1 or H4 to see the main direction, then drop to a lower timeframe if needed. A line drawn on the daily chart usually lasts longer than one drawn on M5. Draw only when you can see all of the following:
- At least two lower highs or two higher lows.
- Price that is not chopping sideways between those points.
- A trend that is still visible when you zoom the chart out.
If one of these is missing, traders should wait rather than force a line.
Step 2: Join two real swing points
A swing point is a high or low with lower highs or higher lows on both sides of it. For a downtrend line, join two swing highs. For an uptrend line, join two swing lows. The two points should be more than a dozen candles apart, because points that sit close together produce a very steep line that breaks easily.
Pick one convention and keep it for every line: join the wicks (highest and lowest prices) or join the closing prices. Many educational guides advise one thing: do not mix a wick at the first point with a candle body at the second.
Step 3: Wait for a third touch to confirm
Two points define a straight line but do not prove it matters. When price returns to the line a third time and reacts, the line becomes more credible. The third touch also shows whether the slope is reasonable.
The price of the line at any candle is calculated like this:
Line price at candle n = Price at point 1 + Slope × Number of candles since point 1
The slope is the price difference between the two points divided by the number of candles between them. The formula lets a trader check the line with numbers instead of by eye, and it is also how to place a price alert exactly where the line will pass.
Worked Example: Gold Downtrend Line From May To July 2026
On daily candles of COMEX gold futures (GC), the swing high on 29 May 2026 reached 4,627.1 and the swing high on 17 June 2026 reached 4,403.6. The two points are 13 candles apart, so the slope is (4,403.6 − 4,627.1) / 13 ≈ −17.19 points per candle.
The figures to record for this line are:
- Point 1: 29 May 2026, high 4,627.1.
- Point 2: 17 June 2026, high 4,403.6.
- Slope: about −17.19 points per candle.
- Line price on the 6 July 2026 candle: 4,214.5.
After the second point, 10 consecutive candles stayed fully below the line. On the candle of 6 July 2026 the line sat at 4,214.5 and the high that day was 4,215.5, just 1 point above it. That was the third touch, and the line was confirmed by a new high sitting right on it, 11 candles after the second point.
The line was then tested a few more times: wicks poked through by 1.2 points on 14 July and 3.4 points on 20 July, but both days closed below the line. A wick slightly through the line like that does not make the line worthless.
Data: daily GC=F candles from Yahoo Finance, retrieved on 3 November 2026. Gold on Yahoo is the COMEX futures contract, so it can differ slightly from XAUUSD at a broker. This is historical price, not a trade recommendation.
Uptrend Line Forex Rules: How To Draw Uptrend And Downtrend Lines
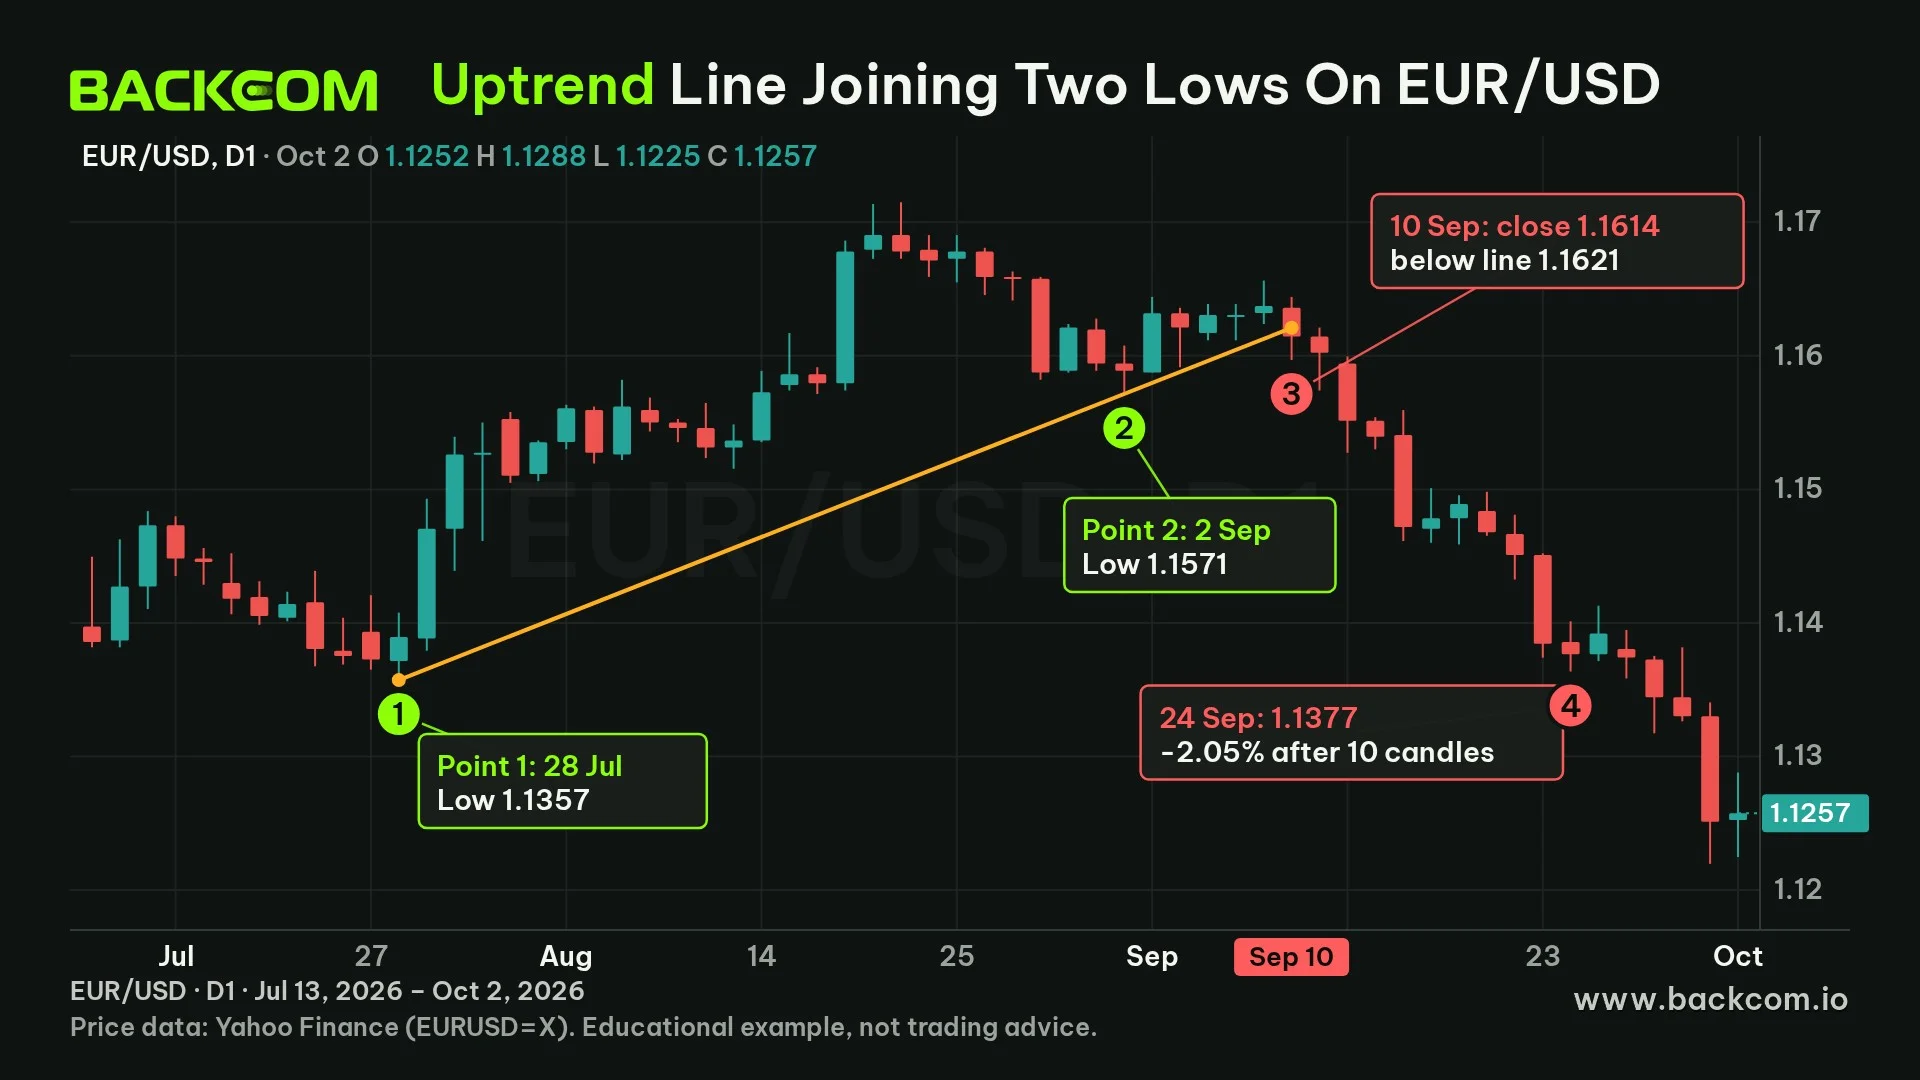
Uptrend and downtrend lines use the same drawing routine but give opposite signals. An uptrend line forex traders draw sits below price, so a pullback to it is where they look for a buy. A downtrend line sits above price, so a rally into it is where traders look for a sell.
The table below summarises the main differences:
| Criterion | Uptrend line | Downtrend line |
|---|---|---|
| Points joined | Two lows, the later one higher | Two highs, the later one lower |
| Position relative to price | Below price | Above price |
| Usual role | Dynamic support | Dynamic resistance |
| Sign of a break | A candle closes below the line | A candle closes above the line |
| What to be careful of | Buying late when price is far from the line | Selling late when price is far from the line |
Reference classification as at 3 November 2026. Traders may use other conventions, so check against your own method before trading.
Worked Example: An Uptrend Line Joining Two Lows On EUR/USD
On daily EUR/USD candles, the swing low on 28 July 2026 was 1.1357 and the swing low on 2 September 2026 was 1.1571. The points are 26 candles apart and the slope is about +0.0008 per candle, or 8.2 pips per day.
After the second point, price tested the area near the line three more times, on 3, 4 and 9 September. The lows of those candles were 1.1587, 1.1592 and 1.1624, which is 4 to 11 pips above the line. Price bounced close to the line without crossing it, and that is when the line looked most valid.
What stands out is that these bounces only pushed price sideways around 1.16 and did not create new highs. When lows hug the line but price can no longer rise, traders should consider that the line may be about to be tested, rather than just waiting to buy again.
Data: daily EURUSD=X candles from Yahoo Finance, retrieved on 3 November 2026. This is historical price, not a trade recommendation.
How To Confirm A Valid Trendline Before You Trade
A valid trendline has enough touches, the touches are spaced far enough apart and the slope is not too steep. Traders do not need a perfect line, but they do need a checklist to filter out lines drawn only to look neat.
Run through these conditions before relying on a line:
- At least three touches with a reaction: two to draw the line and one to confirm it. Lines with four or five touches are generally considered stronger.
- Touches spaced well apart: if three touches are bunched within a few candles, the line says little.
- A moderate slope: an overly steep line is usually a hot move and is often broken by a pause rather than a reversal.
- No large candle bodies cutting through the line: a few wicks poking through is normal, but a body sitting fully on the other side means the line was wrong.
- Fit with the bigger picture: a downtrend line on H1 inside a D1 uptrend is usually less durable.
Traders should also add one factor from outside the line. Examples include a reversal candle at the touch such as a pin bar or an engulfing candle (see the candlestick pattern tool), or an indicator such as the MACD turning at the same time. A single signal from a straight line is usually not enough. Three extra confirmations that are often used are:
- A reversal candle exactly at the touch.
- A momentum indicator turning at the same moment.
- A horizontal support or resistance zone near the touch.
The more factors that coincide, the more the line deserves attention, but it is still not a guarantee.
In MT5, the Trend Line object sits in the Lines group of the Insert menu or the Line Studies toolbar, as described in the MetaTrader 5 objects help. You can also compare the platforms in the guide to MT4 vs MT5.
Trendline Trading Strategy: How To Trade A Breakout, Retest And False Breakout
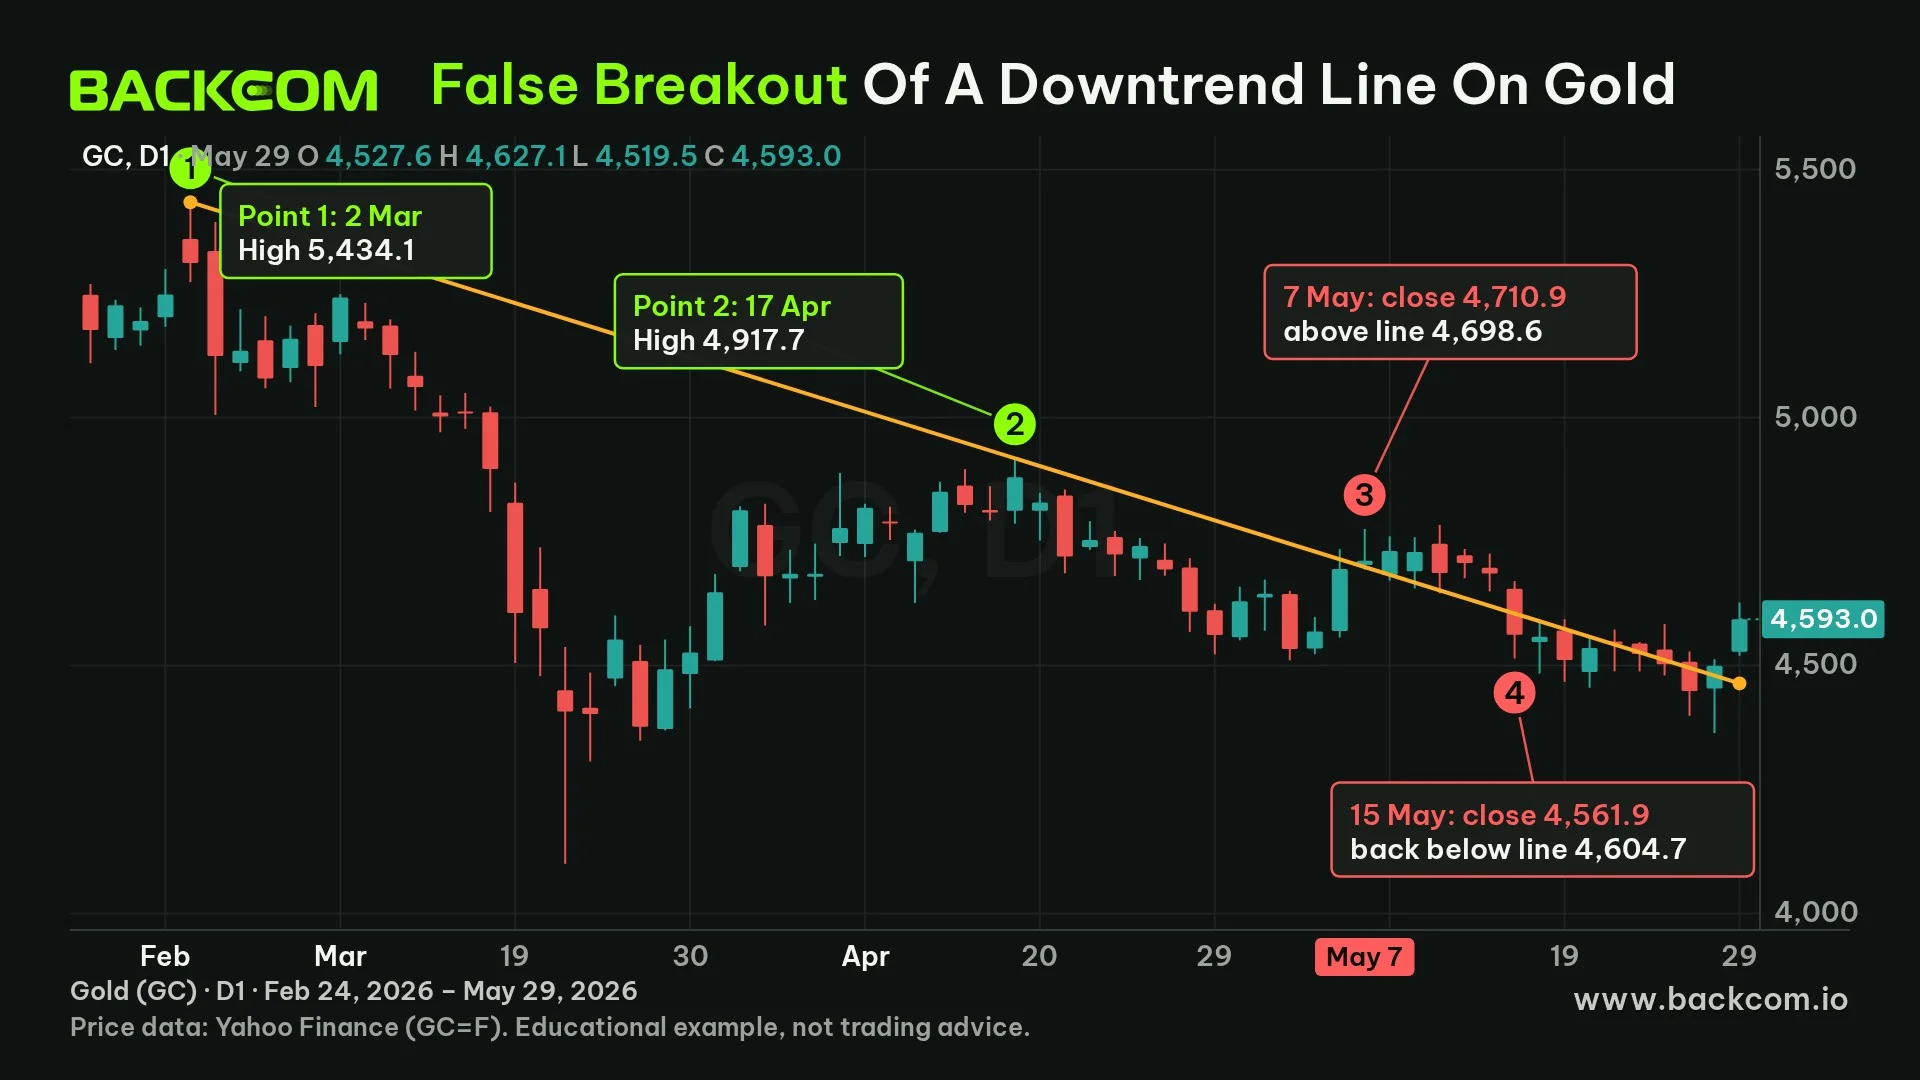
A trendline breakout happens when price closes on the other side of the line, which suggests the previous leg of the trend may be weakening. The most common rule is to use the candle close, not the wick, because a wick poking through a line is an everyday event.
A breakout signal can go one of three ways:
- A real breakout that continues: price closes through the line, comes back to test it from the other side (a retest) and then carries on.
- A real breakout that goes sideways: price leaves the line and then consolidates without forming a new trend.
- A false breakout: price closes through the line for a few candles, then returns to the old side and continues with the original trend.
So a breakout is not a trade by itself. It is a situation that needs confirmation from the size of the break, how long price holds the other side and a stop loss.
Worked Example: A Trendline Breakout On Gold, 21 July 2026
Back to the gold downtrend line above. Extended to the candle of 21 July 2026, the line sat at 4,025.4, while the close that day was 4,076.4, which is 51.0 points (about 1.27%) above the line. It was the first candle to close clearly above the line after the third touch.
Two days later, on 23 July 2026, price dipped but did not come back to test the line: the candle low was only 4,042.5, while the line was then at 3,991.0, some 51.5 points away. So this example has no true retest, and a trader waiting for price to touch the line again before entering would never have got in.
Ten candles later, on 4 August 2026, price closed at 4,152.6, about 1.87% above the breakout close. Within those ten candles, though, the lowest low was 3,993.8 on 29 July, about 2.03% below the breakout close. A trader who entered right at the breakout had to sit through that pullback, so the stop-loss position matters as much as the entry.
Data: daily GC=F candles from Yahoo Finance, retrieved on 3 November 2026. Historical price, not a trade recommendation.
Worked Example: A False Breakout On Gold, 7 May 2026
Another gold downtrend line joins the high of 2 March 2026 (5,434.1) with the high of 17 April 2026 (4,917.7), 33 candles apart, for a slope of about −15.65 points per candle. No candle between the two points has a high above the line, and on 6 May a wick poked 20.3 points through it while the close stayed below.
On 7 May 2026 price closed at 4,710.9 while the line sat at 4,698.6, 12.3 points (about 0.26%) higher. Price held above the line for six consecutive closes, from 7 May to 14 May. On 15 May 2026 it closed at 4,561.9, back below the line (then at 4,604.7). Ten candles after the breakout, on 21 May 2026, the close was 4,542.5, about 3.57% below the breakout close.
What happened next was not tidy. On 21 May the close of 4,542.5 was right on the line, then at 4,542.1. From 28 May to 4 June price closed above the line for six sessions in a row, including a close of 4,593.0 on 29 May, about 129 points (2.9%) above the line at 4,463.9. This time the margin was clear and price held for many sessions, yet on 5 June it closed back below the line (4,365.3 against 4,385.7) and by 11 June it was only 4,114.0. When price has crossed a line back and forth like this, it is better to treat the line as expired than to keep trading it.
The lesson is that the size of the break matters. A close 0.26% through the line is not far from noise. Traders need an extra condition such as a close clearly away from the line, or price holding the other side for several sessions. These conditions filter some noise but do not remove every false breakout, as the 29 May move above shows, so a stop loss remains essential.
Data: daily GC=F candles from Yahoo Finance, retrieved on 3 November 2026. This is historical price, not a trade recommendation.
Worked Example: The EUR/USD Uptrend Line Breaks On 10 September 2026
The uptrend line joining the two lows above passed through 1.1621 on 10 September 2026. That day's candle closed at 1.1614, just under 7 pips below the line. Ten candles later, on 24 September 2026, price closed at 1.1377, about 2.05% below the breakout close.
This example went in the direction of the break, but the break was also only a few pips. Three examples cannot tell a trader the win rate of trendline breakouts. They are three cases picked to illustrate, in which two moved in the direction of the break and one was a false breakout. The article does not measure the whole sample, because a hand-drawn line depends on whoever draws it.
The table below summarises the three cases:
| Case | Breakout date | Close vs line | Result after 10 candles |
|---|---|---|---|
| Gold, downtrend line | 21 July 2026 | 4,076.4 vs 4,025.4 | +1.87% (with the break) |
| Gold, downtrend line | 7 May 2026 | 4,710.9 vs 4,698.6 | −3.57% (false breakout) |
| EUR/USD, uptrend line | 10 September 2026 | 1.1614 vs 1.1621 | −2.05% (with the break) |
Daily candle data from Yahoo Finance, retrieved on 3 November 2026. Results are the change from the breakout close to the close ten candles later, and are not trading advice.
How To Place A Stop Loss When Trading A Breakout
For a downtrend line broken to the upside, the stop should sit below the low of the breakout leg, or below the line by enough to absorb wick stop runs. For an uptrend line broken to the downside, the stop sits above the high of the breakout leg. Placement by invalidation point and ATR is explained in the guide on how to set a stop loss.
Before entering a breakout, traders should settle three things:
- Where the stop loss goes and how far it is from the entry.
- The position size that keeps risk per trade inside the limit already set.
- What would make the breakout signal invalid.
Once the stop is set, traders size the trade using the 1% rule in forex money management and lot size. The position size calculator makes the arithmetic quicker.
5 Common Mistakes When Drawing Trendlines
Trendline mistakes almost always come from wanting the line to fit price instead of letting price test the line. These are the five traders make most often.
1. Drawing the line, then adjusting it to fit
Nudging the first or last point a few candles so the line fits better creates a line that does not exist. A line drawn by the rules stays as drawn, and the data decides whether it is valid.
2. Mixing wicks and bodies
Joining a wick at the first point and a body at the second makes the slope wrong from the start. Choose one convention and apply it to every line.
3. Using two points that are too close together
Two points a few candles apart produce a very steep line, and a steep line is usually broken by a pause rather than a reversal.
4. Entering on the first touch
With only two points there is no evidence yet. Traders should wait for the third touch and a confirming signal such as a reversal candle.
5. Treating every break as a real signal
The gold example of 7 May 2026 shows that six consecutive closes above the line can still be a false breakout. Wait for a clear margin and always set a stop loss.
If you want to stay in a position while the line holds, you can look at how to trail a stop in the guide on what a trailing stop is.
Frequently Asked Questions (FAQ) About Trendlines
How Many Points Do You Need To Draw A Trendline?
You need at least two points to draw a line, and ideally a third to confirm it. A line with three or four touches that each drew a reaction is generally more credible than one with only two points. Traders should treat a two-point line as a hypothesis to test, not as a trading signal.
Should You Draw Trendlines On Wicks Or Candle Bodies?
Both work, as long as you stay consistent. Joining wicks keeps the line close to the highs and lows, while joining closing prices reduces the effect of unusual wicks. What you should not do is join the first point on a wick and the second on a body.
When Is A Trendline Considered Broken?
Most commonly when a candle closes clearly on the other side of the line. A wick that pokes through and closes back is usually not counted. Even so, as the gold example of 7 May 2026 shows, several closes in a row above the line can still be a false breakout, so add a condition on the size of the break and a stop loss.
Can A Trendline Predict Price?
No. A trendline describes a trend that has already formed, and price can respect or break the line at any time. The three examples in this article only illustrate how to draw and read a line, and they do not allow you to infer the win rate of any strategy built on trendlines.
Conclusion: Draw The Line By Rule, Trade It By Stop
Effective trendline drawing starts with choosing the right trend, joining two real swing points, waiting for a third touch and treating a breakout as credible only when a candle closes through the line by a clear margin. Traders need to weigh three things together: the number of touches, the size of the break and the stop-loss position.
The next step is practice on a daily chart of a currency pair or gold: draw the line in three steps, record the date and price of every touch, then compare against the result ten candles later, as in this article. If you are just starting out, read the overview in forex trading for beginners before applying any of this.
Once you have a method, trading cost is the next factor to weigh. You can browse the forex brokers we have reviewed. Backcom.io is an independent introducing broker (IB/affiliate) of some of the brokers listed; rebates are paid from the commission the broker pays Backcom.io, see the risk disclaimer.
Disclaimer: This content is compiled by Backcom.io for information and reference only and is not investment advice, a trading recommendation or financial advice. The examples are historical prices and do not guarantee future results. Trading forex and CFDs carries a high level of risk, and traders need to assess their own ability to bear losses.
Was this article helpful?
Join The Backcom.io Community
Get the latest on trading rebates, trading tips, and broker deals — and connect with thousands of traders worldwide.

Backcom App
Track Your Rebates Every Day
Every rebate is visible by broker and by day. Manage your wallet and withdrawals in one place.
Open Backcom App