What Is A Trading Journal? How To Keep One, With A 12-Column Forex Template


A trading journal records the reasons, the risk and the emotions behind each forex or gold trade, the things the MT5 History tab never stores.
In this article, Backcom.io sets out a 12-column trading journal template, explains how to keep a trading journal, builds a forex trading journal in Excel or Google Sheets and shows how to track loss limits during a prop firm challenge.
What Is A Trading Journal, And How Does It Differ From MT5 History?
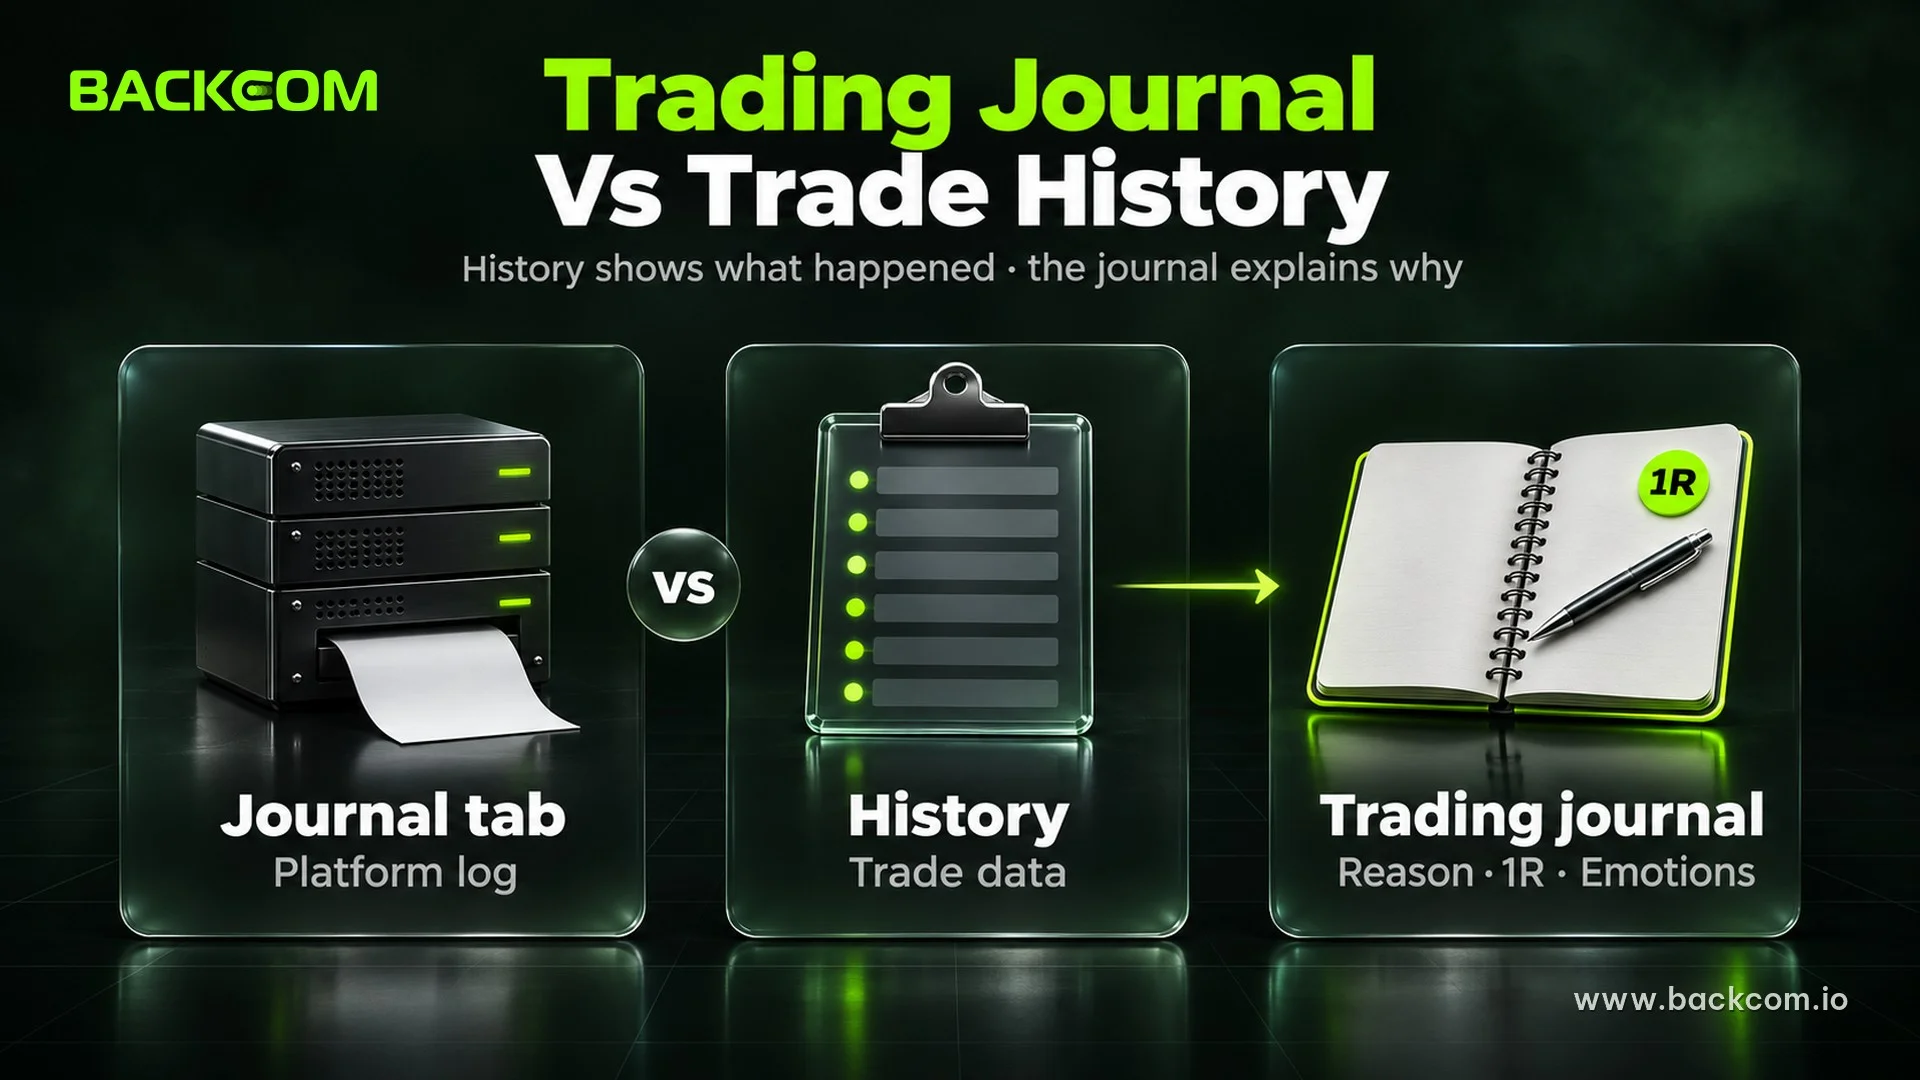
A trading journal is a log a trader fills in for every trade: the reason for entry, initial risk, result after costs, emotional state and lesson. History shows how a trade played out, while the journal explains why you took it.
The Journal tab in MT5 shares the name but only records platform activity:
| Criterion | MT5 Journal tab | History and Trading Report | Trading journal |
|---|---|---|---|
| Who records it | The platform | The broker's server | The trader |
| What it records | Connections, actions, EA messages | Time, symbol, lots, price, fees, Profit | Setup, 1R, emotions, mistakes, chart image |
| Used for | Checking platform activity | How the trade played out | Why you entered |
| What it lacks | Reasons and trading results | Emotions, rebates paid outside MT5 | Needs an entry for every trade |
Why You Still Need A Trading Journal When MT5 Saves Your History
A trading journal adds what the platform cannot know:
- Separating execution errors: entering early or moving the SL is a different problem from a setup that keeps underperforming.
- Measuring the real cost: commission, swap and rebates must be reconciled for a net result.
- Checking prop firm rules: the reset time and daily loss limit must be logged for your programme.
- Judging a setup: many trades with the same tag tell you more than a feeling after two losses.
No reliable study puts a number on how much a journal improves returns, so treat it as a tool for finding repeat mistakes, not a promise of better results.
Trading Journal Template: 12 Columns For Setup, Risk, Costs And Emotions
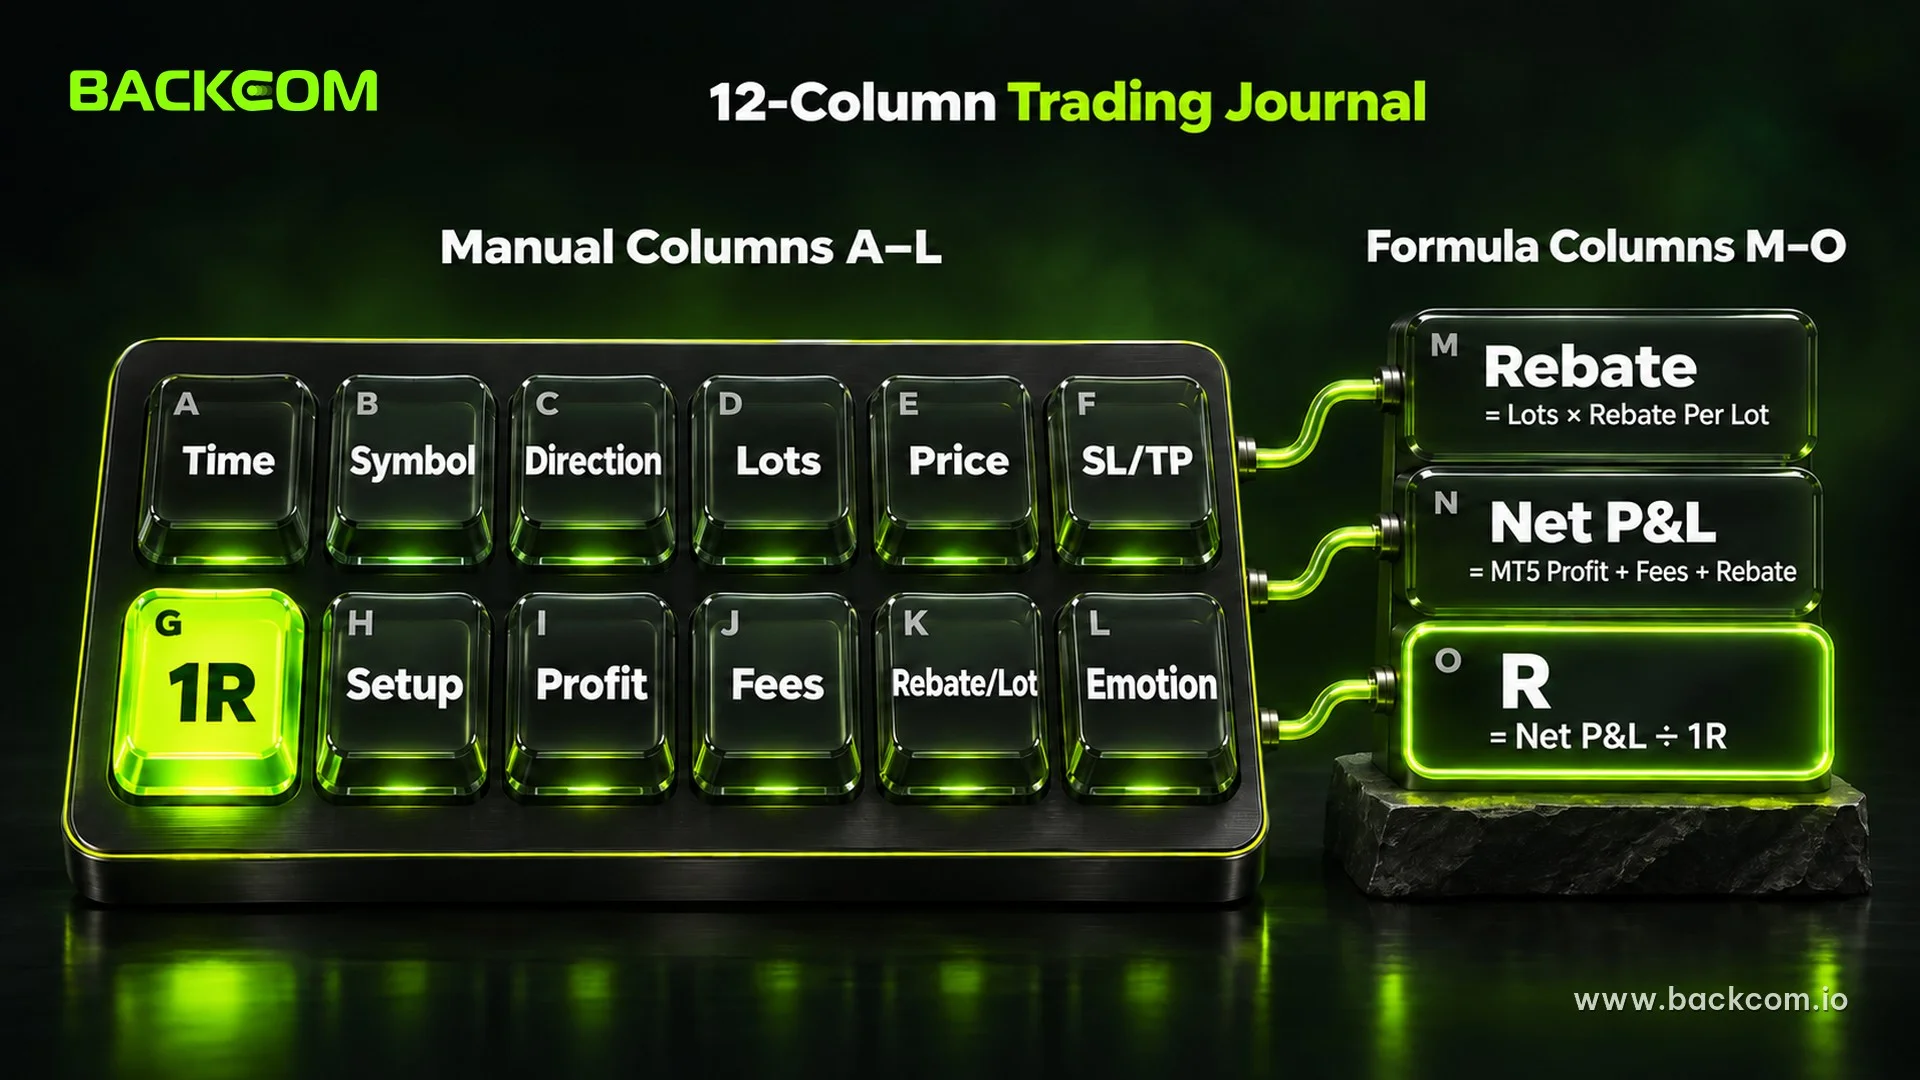
The trading journal template has 12 manual columns, A to L, three formula columns, M to O, and takes Profit straight from MT5.
Hypothetical example: a Buy of 0.25 lot EUR/USD at 1.10000, closed at 1.10440, 1R of $50, Profit +$110:
| Column | Column name | Hypothetical example | Why you need it |
|---|---|---|---|
| A | Entry time | 2026.10.12 09:15, server time | Match the reset time |
| B | Symbol | EURUSD | Filter by symbol |
| C | Direction | Buy | Filter by direction |
| D | Lots | 0.25 | Fees and rebates |
| E | Entry → exit price | 1.10000 → 1.10440 | Check prices |
| F | Initial SL / TP | 1.09800 / 1.10500 | Keep the plan |
| G | Risk 1R, USD | 50 | Denominator for R |
| H | Setup | H1 breakout | Filter by setup |
| I | MT5 Profit, USD | +110 | Result from price |
| J | Commission + swap + fees, USD | −1.50 | Fees as negatives |
| K | Rebate per lot, USD | 1.60 | Rebate amount |
| L | Emotion, mistake, chart link | On plan, 2/5, image link | Repeat mistakes |
Set column G with the 1% rule and lot size formula, then tag H and L with labels such as "FOMO", "revenge" and "early exit".
Three Formula Columns: Rebate, Net Profit And R
Rebate = Lots × Rebate per lot
Net P&L = MT5 Profit + Fees + Rebate
R = Net P&L ÷ Initial risk (1R)
In a spreadsheet:
- Column M, rebate:
=D2*K2calculates the rebate from the lot size. - Column N, net P&L:
=I2+J2+M2adds Profit, fees and the rebate. - Column O, result in R:
=IF(G2>0,N2/G2,"")divides the net result by 1R.
The hypothetical trade gives M = $0.40, N = $108.90 and O = 2.178R.
The MT5 Profit column already includes the spread, because a Buy fills at the Ask and closes at the Bid. Do not subtract it again.
The example uses a Vantage RAW account: a $1.60 EURUSD rebate per lot (rebate page, 16 October 2026) and a $6 round-turn commission, so 0.25 lot pays $1.50 and earns $0.40 back. The figures only fill the columns. Do not count a rebate already in your MT5 balance twice, and see how to calculate a forex rebate per lot.
How To Keep A Trading Journal Before, During And After Each Trade
How to keep a trading journal comes down to three moments:
- Before the trade: fill in A to H, including the initial SL/TP, 1R, the setup and your emotional score.
- During the trade: note in L why you moved the SL or closed early, but never edit F and G, because R uses the initial risk. With a trailing stop, record the automatic moves separately from manual ones.
- After the trade: copy Profit and fees from MT5 into I and J, then add a mistake tag and a one-line lesson.
Also log setups you saw but skipped, leaving the result columns empty.
How To Export MT5 History To Excel Or Google Sheets
Export prices and fees from History, then add the rest by hand.
Exporting MT5 And MT4 Trade History On Desktop
- Open History: press
Ctrl+Tto open the Toolbox and select the History tab. - Choose the view: the right-click menu offers Positions, Deals, Orders and Orders & Deals, where Positions groups one position's deals.
- Choose the period: All History, Last 3 Months, Last Month or Custom Period.
- Create the report: choose Report from the right-click menu or View → Reports to save HTML or PDF (Excel only if your version offers it).
Read the MT5 Trading Account History help and check four points:
- Trades spanning periods: a position opened before the period can be left out, so pick a wider range.
- Server time: the Time column uses the broker's server time, not your local time.
- Empty commission: a broker may charge commission as one balance line per day or month.
- Cost column: shown only if the server supports it, and already inside Profit.
Tip: the 31-character Comment field can hold the setup name, though the server may overwrite it.
MT4 saves HTML through Terminal → Account History → Save as Report or Save as Detailed Report, according to the MT4 documentation. MT5 for iPhone and iPad has Create a trade report → Save as PDF. On Android and in the Web Terminal, export from the desktop terminal instead.
Building A Forex Trading Journal In Excel Or Google Sheets
To build a forex trading journal in Excel, open the HTML report in Excel and save it as .xlsx. Google Sheets imports .xlsx or .csv files through File → Import according to Google's documentation, while a PDF is only for reading.
If formulas break due to your number format, use a semicolon separator, and hide account details before sharing.
Weekly Metrics To Review: Win Rate, Average R And Cost Per Lot
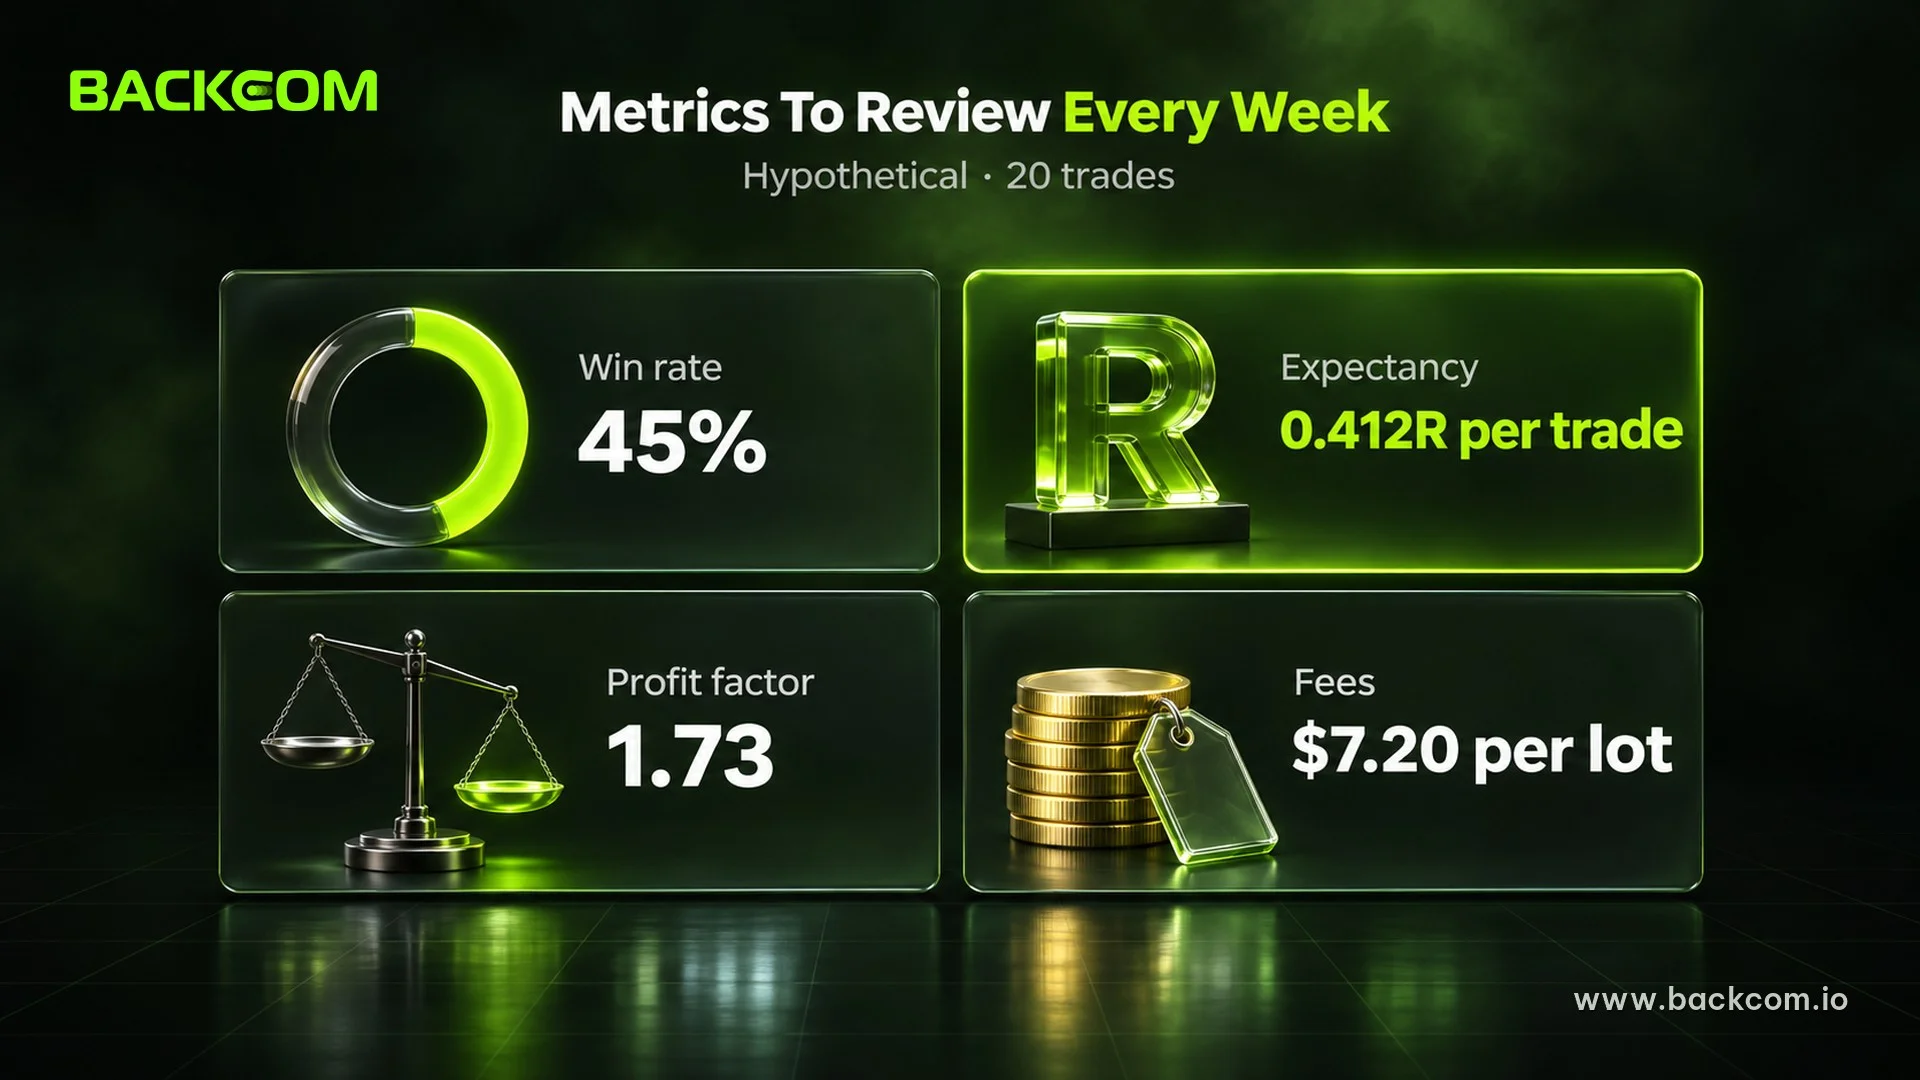
The hypothetical example has 20 EUR/USD trades of 0.25 lot, 5 lots in total. A $5,000 account risks 1% per trade, so 1R = $50. Commission is $6 per lot round turn, the rebate $1.60 per lot (rebate page, 16 October 2026) and the spread an estimated 0.2 pip. One winner pays −$4 in swap and one loser −$2.
| Metric | Excel / Google Sheets formula | Example result |
|---|---|---|
| Number of trades | =COUNT(N2:N101) | 20 |
| Win rate | =COUNTIF(N2:N101,">0")/COUNT(N2:N101) | 45% |
| Average win, USD | =AVERAGEIF(N2:N101,">0") | 108.46 |
| Average loss, USD | =AVERAGEIF(N2:N101,"<0") | −51.28 |
| Expectancy, USD per trade | =AVERAGE(N2:N101) | 20.60 |
| Average R | =AVERAGE(O2:O101) | 0.412 |
| Profit factor | =IFERROR(SUMIF(N2:N101,">0")/ABS(SUMIF(N2:N101,"<0")),"") | 1.73 |
| Total rebate, USD | =SUM(M2:M101) | 8 |
| Fees charged per lot, USD | =-SUM(J2:J101)/SUM(D2:D101) | 7.20 |
| Average R, Breakout setup | =AVERAGEIF(H2:H101,"Breakout",O2:O101) | 0.41 |
| Total R of FOMO trades | =SUMIF(L2:L101,"*FOMO*",O2:O101) | −3.106 |
The figures are hypothetical, not an expected return, and break-even trades need consistent handling.
Win Rate, R And Expectancy Must Be Read Together
A win rate only means something next to the average win and average loss:
Expectancy = Win rate × Average win − Loss rate × Average loss
Before fees, 9 winners averaging 2.2R and 11 losers of −1R give a 45% win rate and an expectancy of 0.44R per trade, or $22. The profit factor is 990 ÷ 550 = 1.80, and the break-even win rate is 1 ÷ (1 + 2.2) = 31.25%.
The Trading Report shows Win Trades, Profit Factor, Recovery Factor, Max. Drawdown, MFE/MAE and Fees by Symbols. Its Summary leaves swap and commission out of Gross Profit/Loss, while the Profit/Loss section includes them, as the MT5 documentation describes.
How Cost Per Lot And Rebates Change The Result
Cost per lot = Spread × Contract + Round-turn commission + Swap per lot − Rebate per lot
The EUR/USD spread, estimated at 0.2 pip, equals $2 per lot and is already inside Profit:
- Fees on 5 lots: $30 of commission plus $6 of swap is $7.20 per lot. With the spread it is $9.20, and after the rebate $7.60 per lot.
- Total result: +$440 from price becomes +$404 after fees and +$412 = 8.24R after rebates. Fees take 8.2% of the price gain, and the rebate offsets 22.2% of the fees.
- Expectancy and profit factor: net expectancy is 0.412R, or $20.60 per trade. The profit factor moves from 1.80 to 1.71 after fees and 1.73 after rebates.
- A trade stopped at SL: a 1R loss from price becomes −1.022R after fees and rebate, or −1.062R with a −$2 swap.
The three losing trades tagged FOMO total −3.106R, about −$155.30. The other 17 trades make +$567.30, an average of $33.37 or 0.667R per trade, with a 52.9% win rate. This is a filter on hypothetical data, not a forecast.
Use COUNTIF(L2:L101,"*FOMO*") to count tags, SUMIF to add up R and AVERAGEIF to compare setups, then compare them with the 7 prop firm challenge mistakes.
Trading Journal For A Prop Firm Challenge: Daily Drawdown
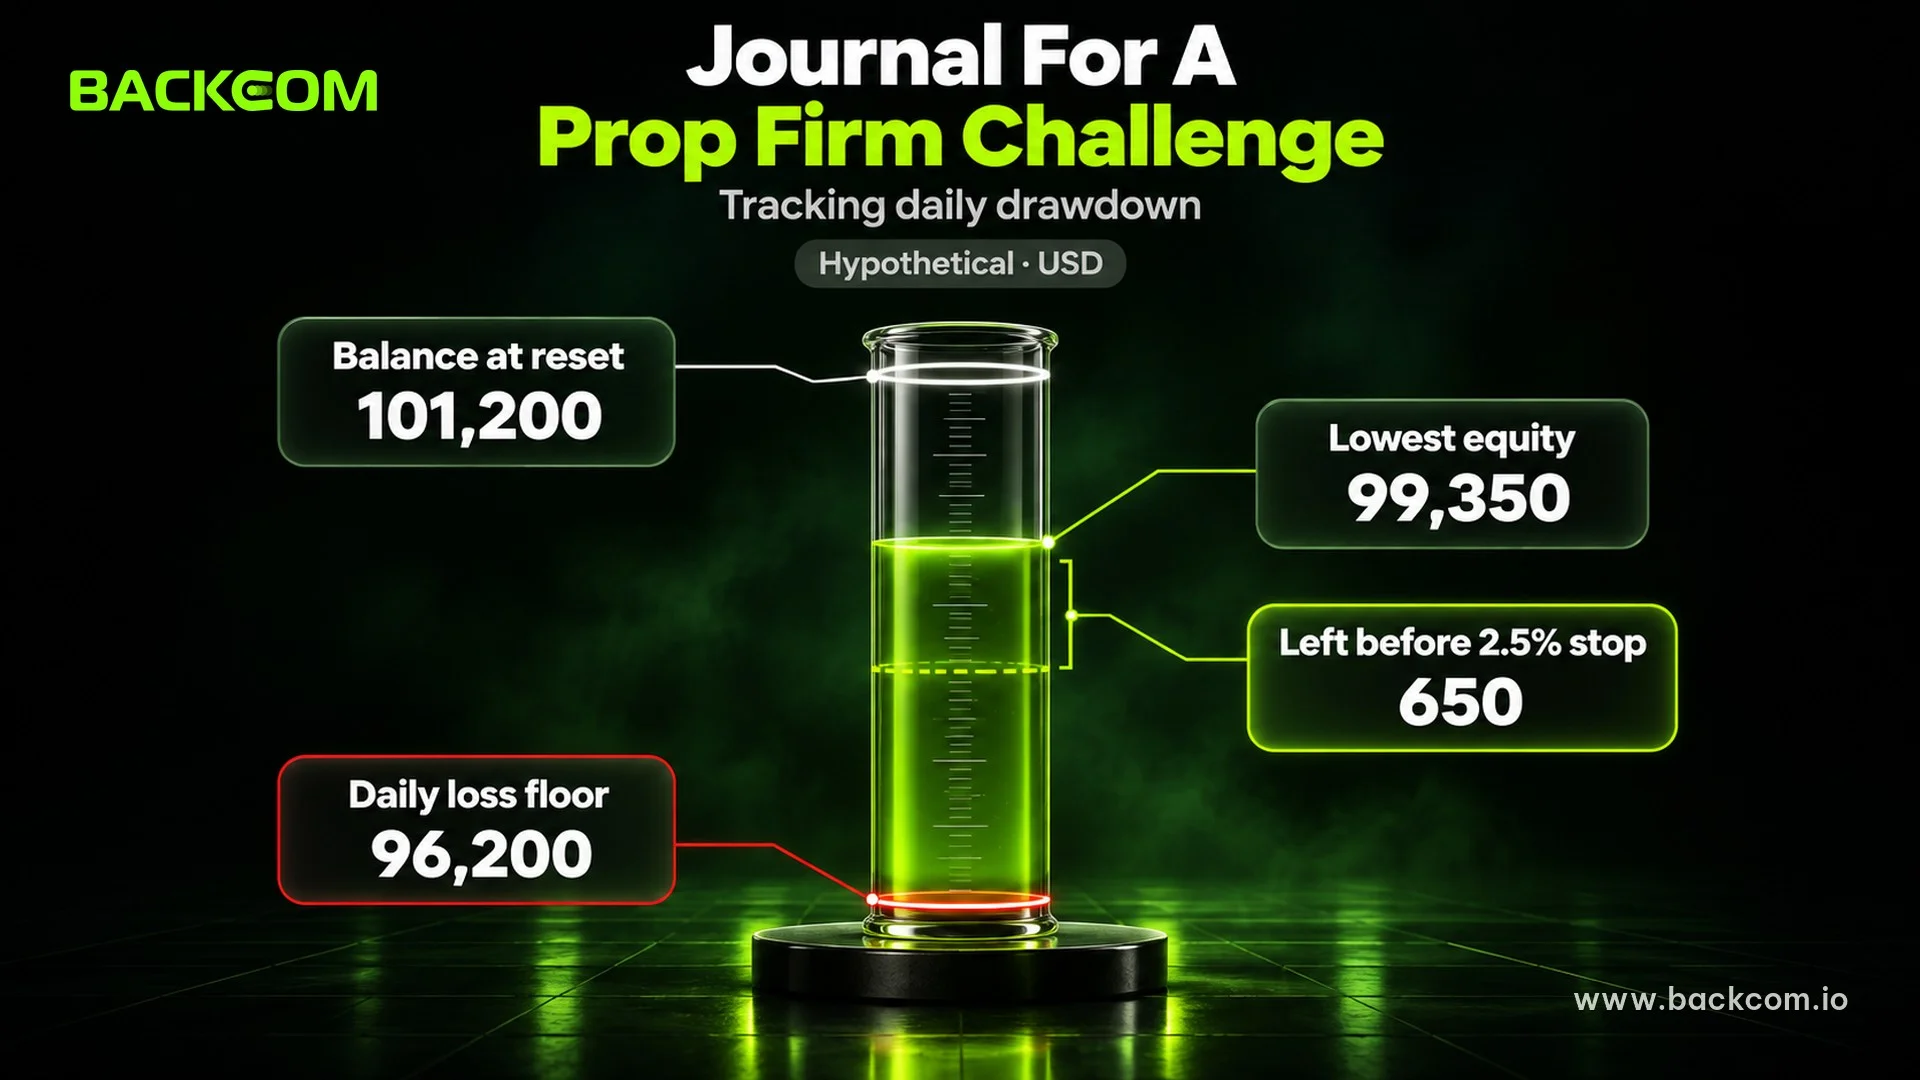
In a challenge, summarise each day by the firm's reset time, not your computer clock.
Four Numbers To Log Each Day On A Funded Account
Log the balance at reset, lowest equity, daily loss floor and overall loss floor, then compare them with your prop firm risk management plan.
Example: a hypothetical FTMO 2-Step $100,000 account with a 5% daily loss limit, a static 10% maximum loss and a 2.5% personal stop.
| Field | Calculation | Amount (USD) |
|---|---|---|
| Balance at reset time | — | 101,200 |
| Daily loss floor | 101,200 − 5% × 100,000 | 96,200 |
| Static overall loss floor | 100,000 − 10% × 100,000 | 90,000 |
| Lowest equity of the day | — | 99,350 |
| Buffer to the daily floor | 99,350 − 96,200 | 3,150 |
| Buffer to the overall floor | 99,350 − 90,000 | 9,350 |
| Lost since the reset balance | 101,200 − 99,350 | 1,850 |
| Left before the 2.5% personal stop | 2,500 − 1,850 | 650 |
That leaves $3,150 before the firm's daily floor but only $650 before the personal stop.
How FTMO And FundedNext Calculate Daily Drawdown Differently
Daily drawdown rules differ between programmes:
- FTMO 2-Step: the daily floor is the balance at 00:00 CE(S)T minus 5% of the initial capital, measured on equity including open trades, fees and swap. Max Loss is a static 10%, and the reset falls at 22:00 UTC during CEST and 23:00 UTC during CET.
- FTMO 1-Step: the daily loss is 3%, and Max Loss is a 10% trailing limit based on the end-of-day balance that only rises with the peak balance.
- FundedNext Stellar 2-Step: a $100,000 account has a base daily limit of $5,000, reset at 00:00 server time. A $2,000 intraday profit can lift that day's limit to $7,000, recalculated after the reset. Check the accepted countries list for your KYC country.
A daily P&L column helps you check the consistency rule, and a "major news" tag filters trades affected by prop firm news trading rules. Each weekend, review off-plan trades against your plan for passing a prop firm challenge.
Warning: the firm's dashboard decides whether a rule was breached, so check it whenever your sheet disagrees.
Frequently Asked Questions (FAQ) About Trading Journals
Is A Trading Journal The Same As The Journal Tab In MT4 Or MT5?
No. A trading journal is your own log of the reason and result of every trade, while the Journal tab in MT4 or MT5 is a platform log with no setups or emotions. Any template you use should keep fee and rebate columns.
Can Google Sheets Open An MT5 History File Directly?
Usually not for HTML or PDF files, because Google Sheets accepts .xlsx and .csv. Open the HTML report in Excel, save it as .xlsx, then use File → Import. If your MT5 version offers an Excel export, import that file directly.
Should You Keep A Trading Journal For Demo Trades?
Yes, with every column filled in, but keep demo trades apart from live ones. Challenge trades need logging too, because a rule breach can end the account. Demo psychology and execution differ from live trading, so compare the data before increasing size.
How Often Should You Review Your Trading Journal?
Every week, review win rate, average R, costs and off-plan trades, and during a challenge check the four drawdown numbers daily. Twenty trades is a small sample for judging a setup, so look at mistakes before total P&L.
Should Rebates Be Added To P&L In The Journal?
Yes, in a separate column, so you can compare results before and after the rebate: lots times the rebate per lot, added to P&L after fees. If the rebate already sits in your MT5 balance, do not add it again. Judge a setup after fees first.
Conclusion
A trading journal links your results in R, your cost per lot and your repeat mistakes. Build the 12-column trading journal template, log each trade at the three moments, then review the metrics weekly and the four prop firm numbers daily.
For the right rebate per symbol and account, see the forex rebate rates for each broker. Backcom.io is an independent introducing broker (IB/affiliate) of the brokers listed; rebates are paid from the commission the brokers pay Backcom.io — see the risk disclaimer.
Disclaimer: This content is compiled by Backcom.io for information only and is not investment advice or a trading recommendation. The 20-trade example and the funded account are hypothetical. Rebate rates refer to 16 October 2026, and prop firm rules and platform features can change, so check the official conditions first.
Was this article helpful?
Join The Backcom.io Community
Get the latest on trading rebates, trading tips, and broker deals — and connect with thousands of traders worldwide.

Backcom App
Track Your Rebates Every Day
Every rebate is visible by broker and by day. Manage your wallet and withdrawals in one place.
Open Backcom App