What Is Drawdown In Trading? Formula, Maximum Drawdown And Recovery Guide

An account that has just grown 25% and then slides back to its starting point is a familiar story for many traders, and the number that describes that fall has its own name. Without knowing what is drawdown in trading, it is easy to watch the profit and loss of single trades while ignoring the cumulative decline that decides whether the account can keep trading at all.
Knowing how to calculate drawdown lets a trader measure how far the account sits below its equity peak, while the maximum drawdown formula shows how deep a strategy's worst fall has been. With a drawdown in a forex account, many traders only pay attention when the account is close to blowing up, yet the maths of how to recover from drawdown shows that every extra percentage point of loss costs more than the one before.
In this article, Backcom.io walks through the definition, the formulas, worked examples on a $10,000 account and a three-level routine for keeping drawdown within limits.
What Is Drawdown In Trading? The Decline From Peak Equity To Trough
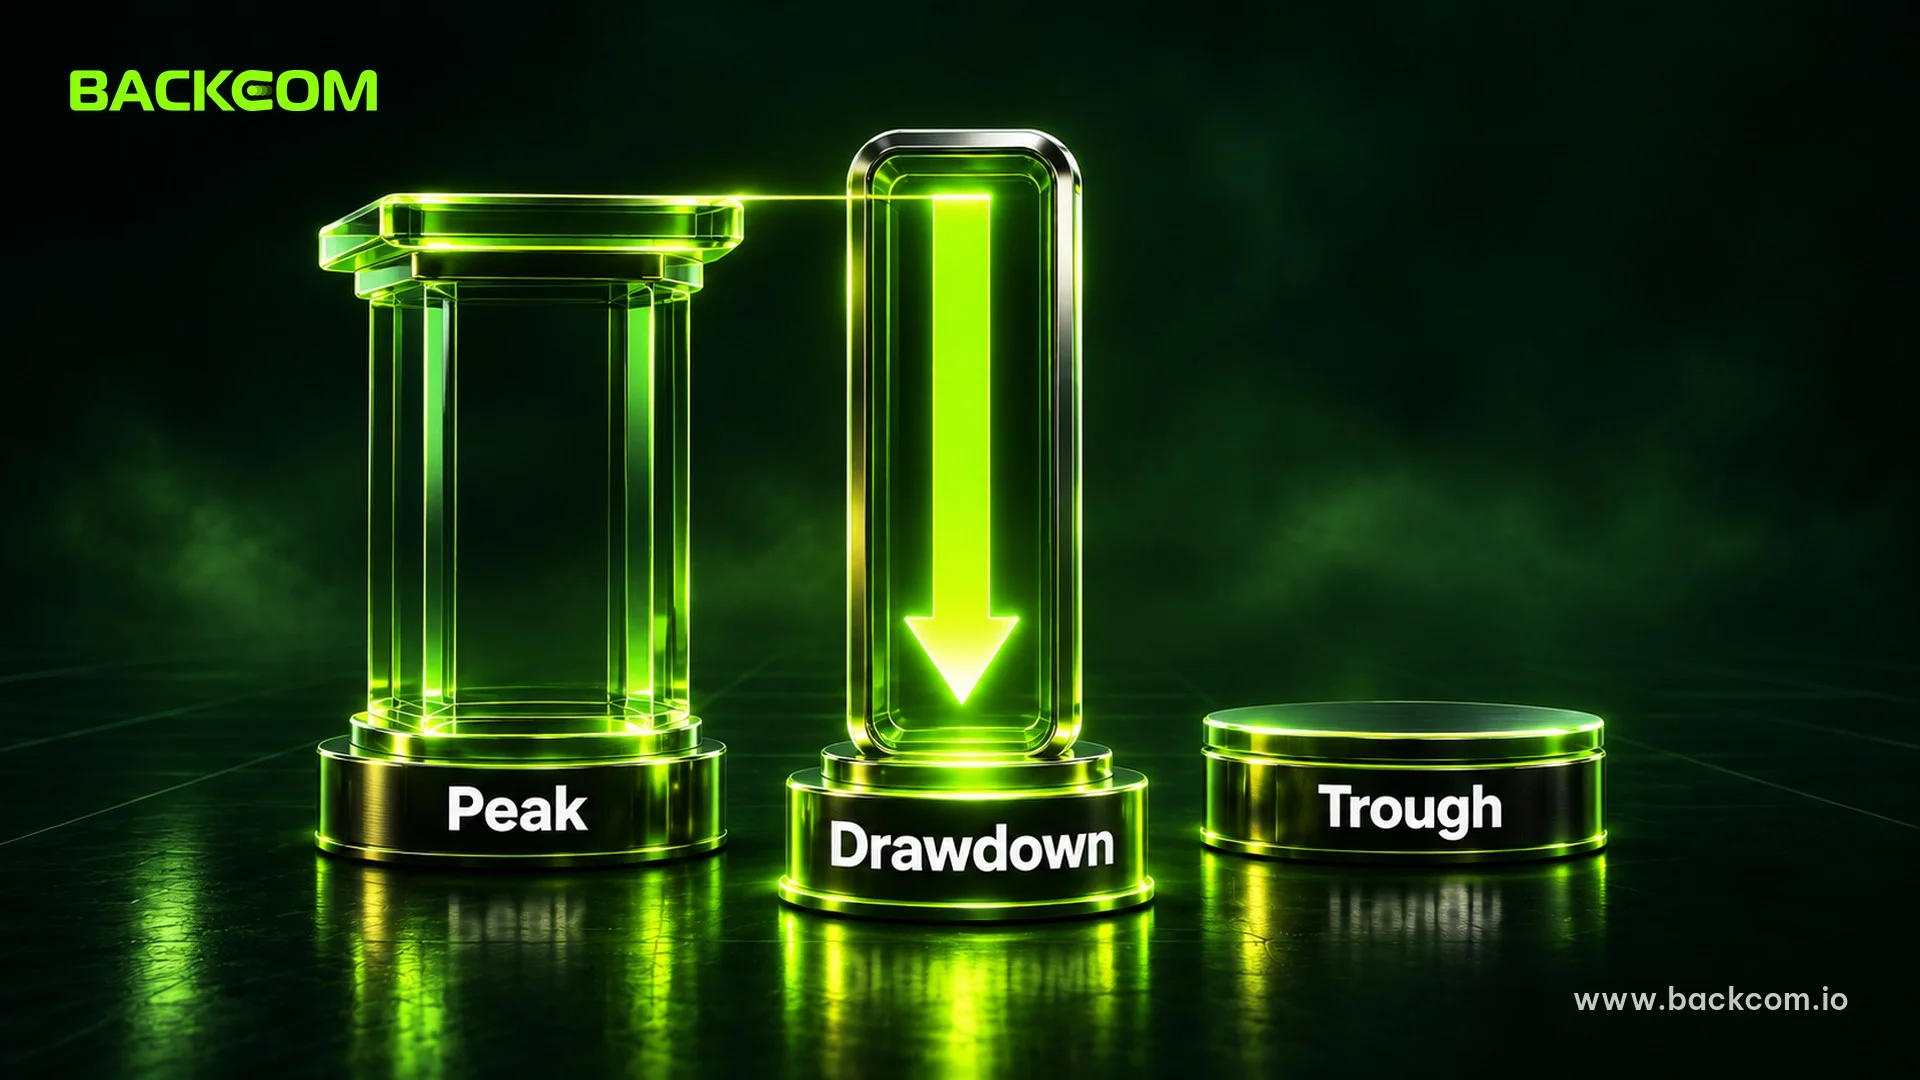
What is drawdown in trading? Drawdown is the decline in an account measured from its most recent equity peak down to the point being examined, usually shown as a percentage or an amount of money. According to the Wikipedia entry on drawdown, it measures the decline from a historical peak in some variable, typically the cumulative profit or open equity of a trading strategy.
The key point is that drawdown is always measured against the peak, never against the deposit. An account that starts at $10,000, rises to $12,500 and then falls to $11,000 is in a 12% drawdown even though it is still 10% up on the original capital.
Traders usually meet three uses of the word:
- Current drawdown: the gap between the latest peak and the account value right now.
- Maximum drawdown: the largest peak-to-trough decline over the whole period under review.
- Absolute drawdown: the lowest point relative to the starting balance.
Drawdown By Balance And By Equity
Balance changes only when a trade closes, while equity also includes the floating profit or loss of open positions. Drawdown by equity therefore reflects real risk sooner, and it is the measure many funded-trader programmes use when checking loss limits.
Take a simple example: a balance of $10,000 and a buy position that is currently down $600. Equity is $9,400, a 6% equity drawdown, even though the balance has not moved and the trade history shows no losing trade. A trader who only watches balance will think the account is fine until the position is closed.
How To Calculate Drawdown: The Formula And A $10,000 Account Example
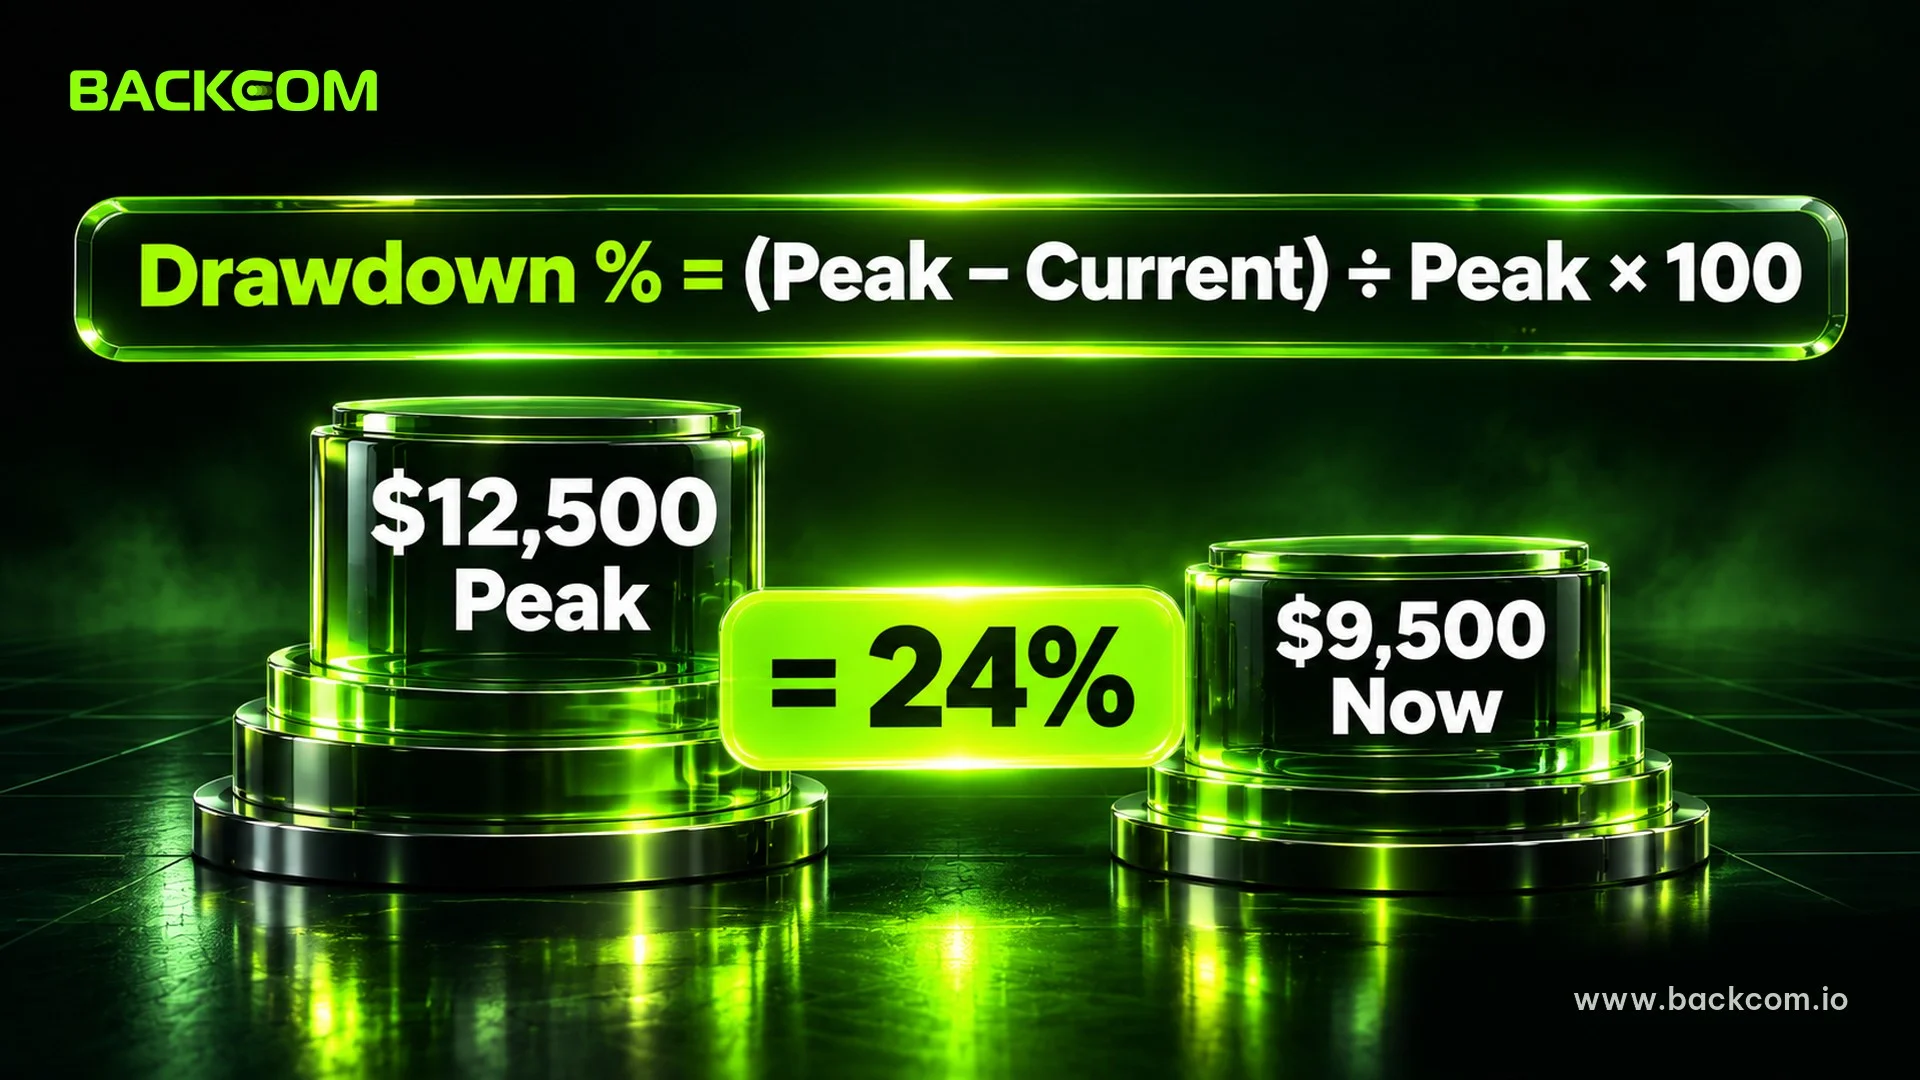
How to calculate drawdown needs only two numbers: the latest equity peak and the current account value. The percentage formula is:
Drawdown (%) = (Peak Equity − Current Equity) ÷ Peak Equity × 100
Suppose an account opens with $10,000 and moves through these levels:
- The account climbs to a $12,500 peak after several profitable weeks.
- A run of losing trades pulls equity down to $9,500.
- Drawdown at the low is ($12,500 − $9,500) ÷ $12,500 × 100 = 24%.
- Against the starting balance the account is only $500 short, an absolute drawdown of 5%.
Both 24% and 5% are correct, but they answer different questions. The first shows how much of the gains the trader has given back, and the second shows whether the original capital is still intact.
Traders should log drawdown in both money and percentage terms, because a percentage can hide the size of the cash loss once the account has grown.
| Moment | Equity | Peak Equity | Drawdown (Money) | Drawdown (%) |
|---|---|---|---|---|
| First peak | $12,500 | $12,500 | $0 | 0% |
| After the losing run | $9,500 | $12,500 | $3,000 | 24% |
| Partial rebound | $10,800 | $12,500 | $1,700 | 13.6% |
| New peak | $12,800 | $12,800 | $0 | 0% |
Illustrative figures calculated for explanation only, not the results of any real trading account.
Notice that drawdown returns to 0% the moment the account sets a new peak, even after a 24% slide. A low current drawdown therefore says nothing about the falls already behind the account, which is why traders also need maximum drawdown.
Maximum Drawdown Formula: Why Traders Look At The Worst Decline
Maximum drawdown (MDD) is the largest peak-to-trough decline within the period under review, and it is the most common risk measure for judging a strategy or a fund. Wikipedia describes it as the worst loss from a peak to a trough since the start.
The maximum drawdown formula is a procedure rather than a single line. Take each peak, find the lowest trough after it, compute the drawdown for each pair and keep the largest. Consider this equity path:
- Equity rises to $11,000, the first peak.
- Equity falls to $9,900, a 10% drawdown.
- Equity rises to a new peak of $12,000.
- Equity falls to $9,600, a 20% drawdown.
- Equity recovers to $10,800, leaving a current drawdown of 10%.
Maximum drawdown for this path is 20%, not the 10% seen at the end.
Drawdown Duration And The Calmar Ratio
Depth is not the whole story. Wikipedia also describes drawdown duration, the time between two peaks, and notes that the longest stretch does not necessarily coincide with the maximum drawdown. A strategy that falls 15% but needs eight months to set a new peak can feel worse than one that falls 25% and recovers in six weeks.
To combine return and risk in one figure, traders can use the Calmar ratio, which divides the average annual return over the latest 36 months by the maximum drawdown of the same period. Per Wikipedia, Terry W. Young first published it in 1991 in the magazine Futures. A strategy averaging 30% a year with a 15% maximum drawdown has a Calmar ratio of 2.0.
Calmar can only be compared across strategies that share the same start and end dates. Maximum drawdown also reflects only the fall that has already happened, so it should not be treated as a ceiling on risk.
Drawdown In A Forex Account: How Losing Streaks And Risk Per Trade Create Declines
Drawdown in a forex account usually comes from a losing streak combined with the amount risked per trade, and rarely from one bad loss. The formula for a streak is:
Drawdown after n losing trades = 1 − (1 − r)^n
Here r is the percentage of equity risked per trade. Each loss cuts into the remaining balance rather than the starting balance, so drawdown grows more slowly than simple multiplication suggests.
| Risk Per Trade | After 5 Losses | After 10 Losses | After 20 Losses |
|---|---|---|---|
| 1% | 4.90% | 9.56% | 18.21% |
| 2% | 9.61% | 18.29% | 33.24% |
| 3% | 14.13% | 26.26% | 45.62% |
| 5% | 22.62% | 40.13% | 64.15% |
Pure formula results, before spread, fees or slippage.
At 1% risk, ten consecutive losses cost the account only 9.56%. At 5% risk the same streak costs 40.13%, and the trader then faces the heavy recovery maths covered below. This is why money management and the 1% rule are the first topics in any discussion of long-term survival, and a position size calculator turns a 1% risk into a concrete lot size.
Three Things That Make Drawdown Deeper Than Planned
The table assumes each loss costs exactly one unit of risk. In practice at least three factors push the real number higher:
- Trades not closed as planned: moving or removing a stop loss makes a loss larger than the planned r. A structured approach to stops is covered in how to set a stop loss using invalidation and ATR.
- Adding to losing positions: averaging down doubles exposure exactly when the account is weakest, as explained in pyramiding versus averaging down.
- Several same-direction trades on correlated pairs: three buy trades on three pairs that all lean on the US dollar are effectively one trade with triple the risk.
High leverage makes every small move a large share of equity. Traders should also read about leverage in forex and how to calculate margin to see where the margin call level sits.
Recover From Drawdown: Why A 50% Loss Needs A 100% Gain
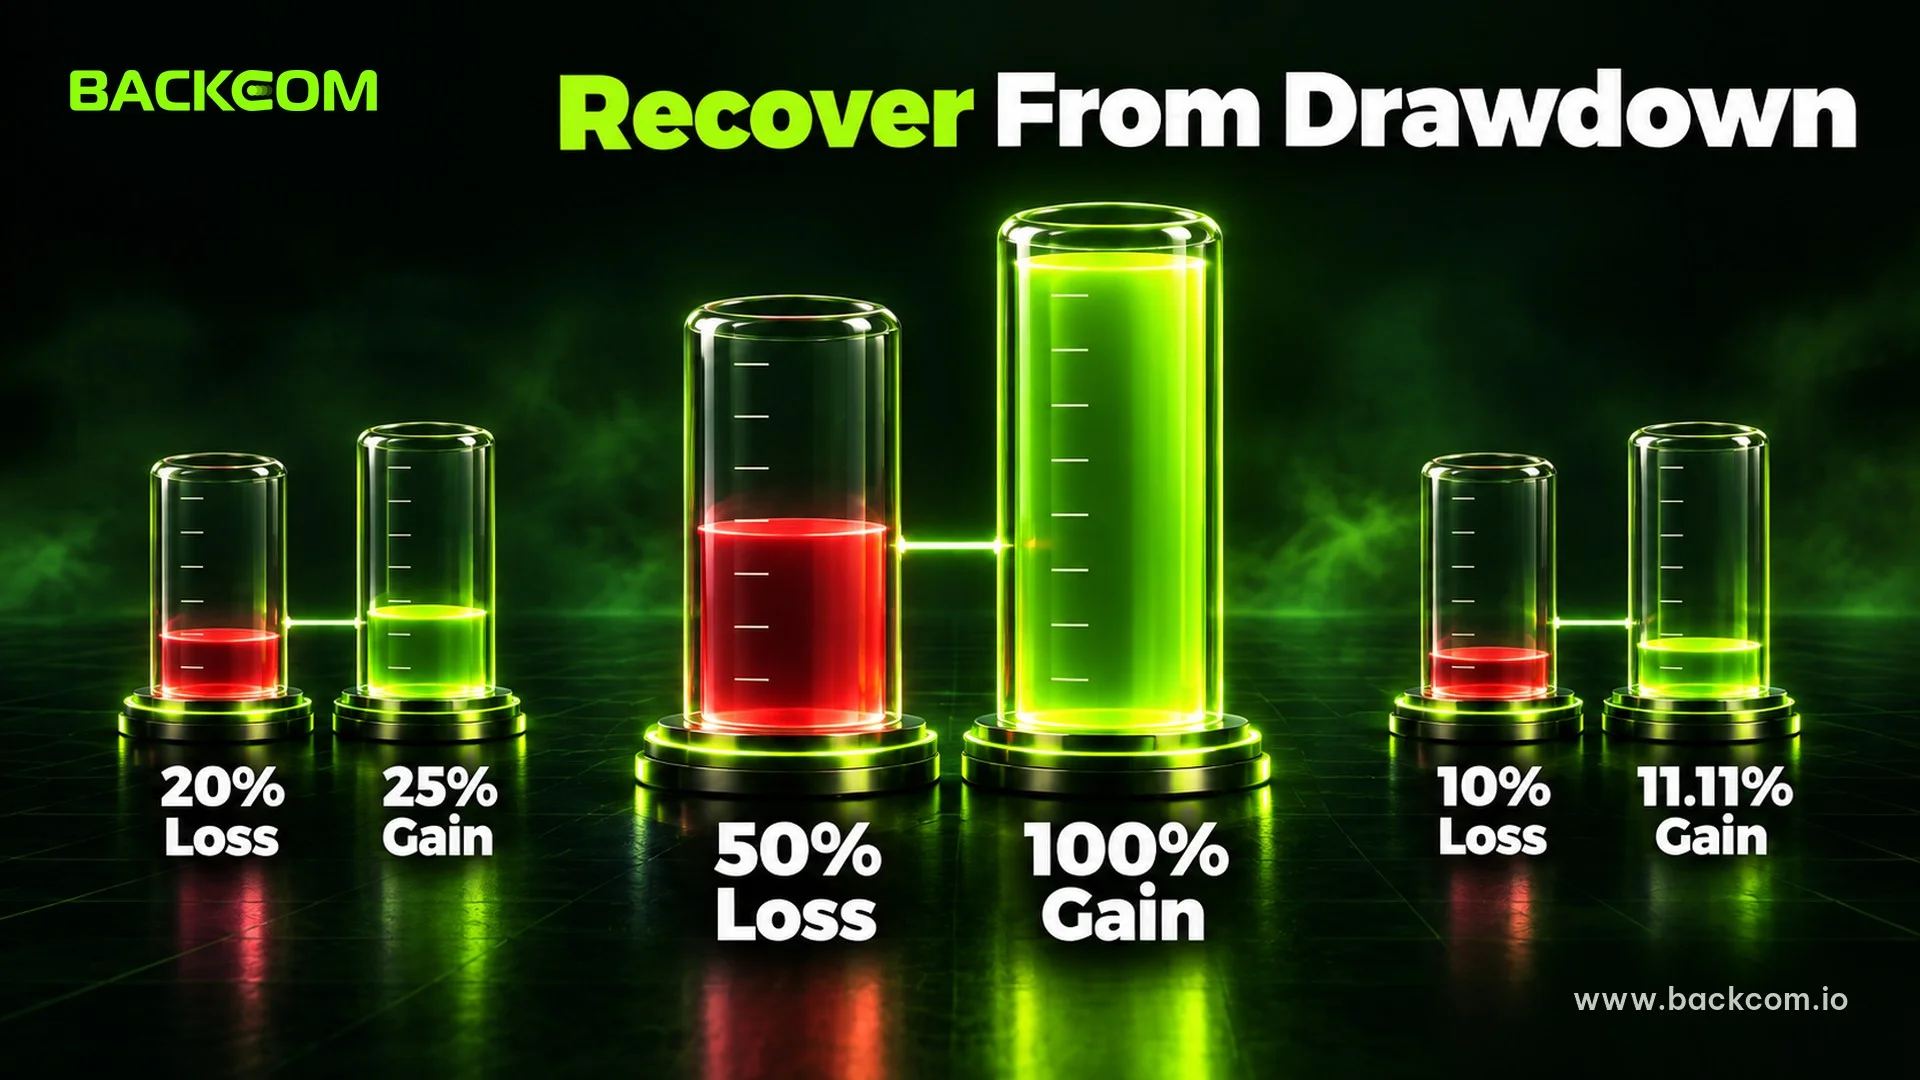
To recover from drawdown means earning enough to bring the account back to its previous peak, and the required gain is always larger than the loss. The reason is that the gain is earned on the smaller balance left after the loss, not on the old peak.
Gain needed to recover (%) = Drawdown ÷ (1 − Drawdown) × 100
A $10,000 account that loses 50% is left with $5,000. To get back to $10,000 the trader must earn $5,000 on a $5,000 balance, which is 100%. The table shows how steeply the requirement climbs:
| Drawdown | Balance Left From $10,000 | Gain Needed To Reach The Peak |
|---|---|---|
| 5% | $9,500 | 5.26% |
| 10% | $9,000 | 11.11% |
| 20% | $8,000 | 25% |
| 30% | $7,000 | 42.86% |
| 50% | $5,000 | 100% |
| 75% | $2,500 | 300% |
| 90% | $1,000 | 900% |
Mathematical illustration only, not a forecast of trading results.
Two lessons stand out. Up to a 10% drawdown the gain needed is only slightly above the loss, but beyond 30% the figure rises very fast. And trying to win it back quickly by raising lot size usually deepens the drawdown, because a weakened account is taking more risk.
Recovery Takes Time, Not Just Percentage Points
Suppose a trader sustains a 3% monthly gain. Making back a 20% drawdown needs a 25% gain, around 8 months if everything runs smoothly, an assumption that rarely holds. For a 50% drawdown the same pace takes nearly two years.
Preventing a deep drawdown is therefore far cheaper than repairing one, and once the account is deep the first goal is to stop the slide before thinking about recovery.
Keeping Drawdown Within Limits: A Three-Level Routine
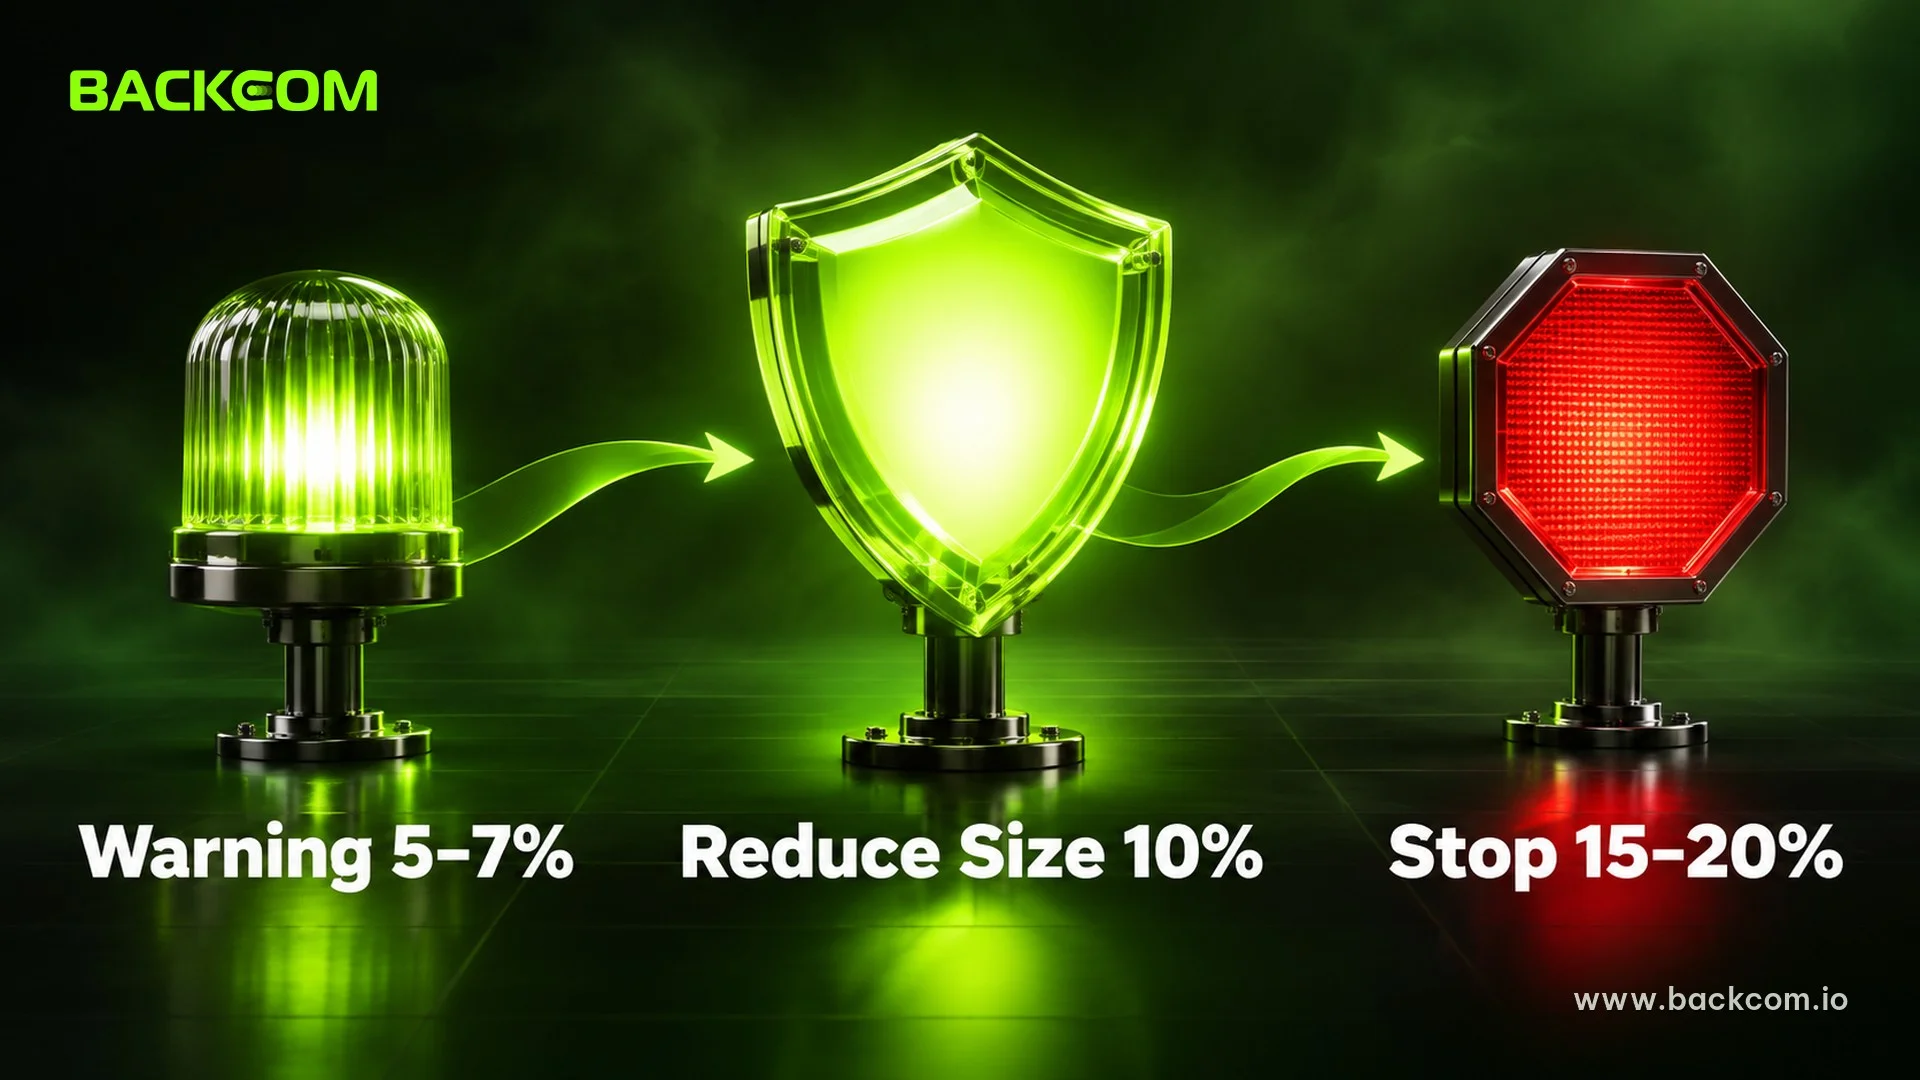
A drawdown limit should be set before trading, as a specific number and not as a feeling in the middle of a losing run. A three-level routine helps a trader follow a plan instead of reacting emotionally.
Level 1: Warning at 5% to 7%. When drawdown reaches this range, review the trading journal, confirm that the losses followed the plan and keep risk per trade unchanged. If the losses came from breaking the rules, stop and fix the process first.
Level 2: Reduce size at 10%. Here a trader should halve the risk per trade, for example from 1% to 0.5%, until the account sets a small new peak or logs at least 10 trades that follow the plan. This slows the slide and keeps capital available for recovery.
Level 3: Stop completely at 15% to 20%. This is the level to pause trading, return to backtesting or a demo account and come back only after the cause is understood. The exact number is the trader's own choice based on temperament and capital, as long as it is written down in advance.
For the routine to work, a trader should prepare four things:
- Record end-of-day equity so that the peak and the current drawdown are known without guessing.
- Place a stop loss on every trade, using the order types in MT5 that the platform supports.
- Set a daily loss limit at half of the warning level so that a single session cannot use up the whole risk budget.
- Write down the action for each level, since decisions made during a loss often differ sharply from those made calmly.
On a funded-trader account the limit is no longer the trader's own choice, because the firm sets it. Many firms cap total loss at around 10% of the starting balance, alongside a daily loss limit, and some calculate it on a trailing basis. The article on prop firm risk management compares individual firms as at 24 September 2026 and explains the difference between static and trailing drawdown. A firm's published rules can be seen directly on FTMO's trading objectives page, and they should be rechecked before buying a challenge because the parameters can change.
Frequently Asked Questions (FAQ) About Drawdown
What Drawdown Percentage Is Acceptable?
There is no single figure for every trader. Many individual traders set a ceiling around 10% to 20% of equity, because once the decline passes 20%, to recover from drawdown a gain of more than 25% is needed. Pick a level at which you can still follow your plan calmly, and write it down in advance.
Is Drawdown The Same As A Loss?
No. A loss usually refers to a negative result against the starting balance or a single trade, while drawdown measures the decline from the latest equity peak. An account can be 10% up on its original capital and still be in a 12% drawdown from its peak, as in the example at the start.
Does A Low Maximum Drawdown Mean A Good Strategy?
Not necessarily. A low maximum drawdown can come from a short data window or an easy market, and it only describes the fall that has already happened. Check the number of trades, drawdown duration, the Calmar ratio and results in difficult markets before drawing a conclusion.
Does Drawdown By Equity Or By Balance Matter More?
For risk control, equity matters more because it includes the floating profit and loss of open positions. Many funded-trader programmes also check loss limits on equity, so you should read each programme's rules to see exactly which measure it uses.
Conclusion
Drawdown measures the decline from peak equity, and traders need to look at three angles together: depth through the percentage formula, length through the time taken to return to a peak, and difficulty through the gain needed to recover. The most striking figure in this article is that a 50% loss needs a 100% gain to get back to the old level.
The practical steps are to calculate drawdown on equity at the end of each day, to risk little enough per trade that a long losing streak cannot wreck the account, and to write down the three action levels before the market pushes you into panic. To build a risk foundation, start with money management and the 1% rule, then return to the losing-streak table above to choose a suitable risk level.
Disclaimer: This content is compiled by Backcom.io for information and reference only and is not investment advice, a trading recommendation or financial advice. The numerical examples are self-calculated illustrations, forex trading carries a risk of losing capital and traders are responsible for their own decisions. See also the Backcom.io risk disclaimer.
Was this article helpful?
Join The Backcom.io Community
Get the latest on trading rebates, trading tips, and broker deals — and connect with thousands of traders worldwide.

Backcom App
Track Your Rebates Every Day
Every rebate is visible by broker and by day. Manage your wallet and withdrawals in one place.
Open Backcom App