Stochastic Oscillator Explained: How To Read %K, %D, Overbought, Oversold And Divergence

Many traders see an indicator touch 80 and assume price is about to turn, then sell against a rally that is still running. The question looks simple, but a stochastic oscillator explained properly starts with where the %K and %D lines come from. Without that, it is easy to read the 80 and 20 levels as sell and buy orders.
In this article, Backcom.io walks through what traders most often look up about this indicator, with measurements on real gold prices:
- What the stochastic oscillator is and the formula behind the Stochastic 14 3 3 settings, with a hand calculation on the gold candle of 24 August 2026.
- Stochastic overbought and oversold readings at 80 and 20, and why the indicator can sit there for a long time.
- How to use the stochastic oscillator through %K and %D crossovers, with hit rates measured over two years of data.
- Stochastic divergence, an early but easily misread signal, and how to add the indicator in MT5.
Stochastic Oscillator Explained: An Indicator That Shows Where Price Closes In Its Range
The stochastic oscillator is a momentum indicator that shows where the closing price sits between the highest high and the lowest low of a recent set of candles, on a scale from 0 to 100. A reading near 100 means the close is near the top of the range, and a reading near 0 means it is near the bottom.
The key point is that unlike RSI or MACD, the stochastic does not compare the size of up and down moves. It answers one narrow question: did the latest candle close near the top or the bottom of the last 14 candles? According to the StockCharts ChartSchool, George C. Lane developed the indicator in the late 1950s, and he believed momentum usually changes direction before price does.
A stochastic on the chart has two lines and three reference levels:
- The %K line: the position of the close within the high-low range, and the more sensitive line.
- The %D line: a moving average of %K that runs slower and acts as the signal line.
- The 80, 50 and 20 levels: above 80 the close is near the top of the range, below 20 it is near the bottom, and 50 splits the range in half.
For that reason, traders should treat the stochastic as a way to measure where price sits in its recent range, not as a reversal alarm. For a different kind of momentum, the MACD indicator guide covers an indicator built from two exponential moving averages.
How The Stochastic 14 3 3 Is Calculated
The Stochastic 14 3 3 setting means 14 candles to find the high and low, 3 candles to smooth the %K line, and 3 candles to smooth the %D line. According to StockCharts, 14-3-3 is one of the commonly used settings, alongside 20-5-5, with the traditional 80 and 20 levels.
The raw %K formula is one line, as given on the official MetaTrader 5 help page:
%K = (Close − Lowest Low Of N Candles) ÷ (Highest High Of N Candles − Lowest Low Of N Candles) × 100
%D = Simple Moving Average Of %K Over 3 Periods
There are three versions, depending on how much smoothing is applied, according to StockCharts and MT5:
- Fast stochastic: %K is the raw formula with no smoothing, and %D is the 3-period average of %K.
- Slow stochastic: the raw %K is smoothed by another 3 periods, so the slow %K is the same line as the fast %D.
- Full stochastic: the trader chooses all three periods, and 14-3-3 is one way of setting it.
Worked Example: %K And %D On Real Gold Prices
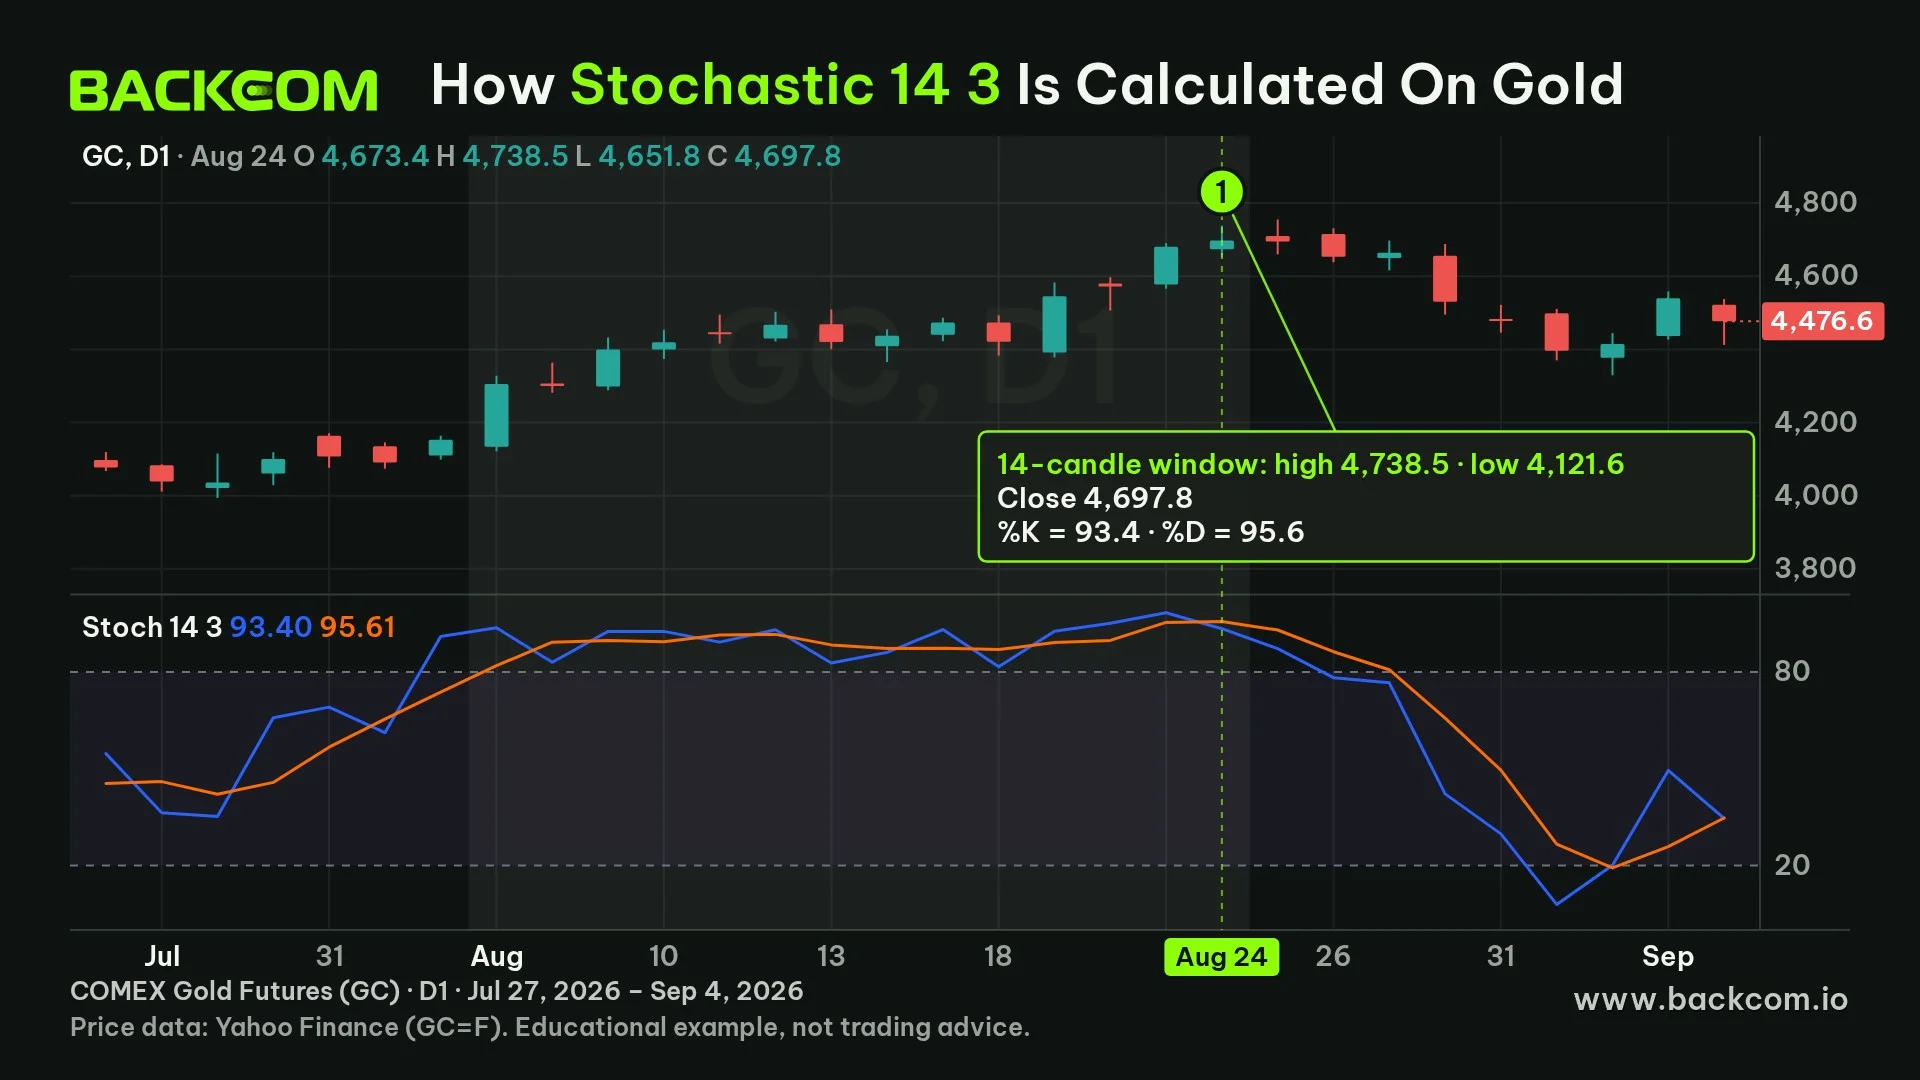
The chart at the top of this section plots a fast 14, 3 stochastic from daily COMEX gold futures (GC) candles. The blue line is the raw %K, the orange line is %D, and the shaded area marks the 14 candles used to find the high and low for 24 August 2026.
Over the 14 candles from 5 August 2026 to 24 August 2026, the highest high was 4,738.5 and the lowest low was 4,121.6 USD. The 24 August candle closed at 4,697.8, so:
- %K: (4,697.8 − 4,121.6) ÷ (4,738.5 − 4,121.6) × 100 = 576.2 ÷ 616.9 × 100 = 93.4.
- %D: the %K values of 20 August, 21 August and 24 August were 95.1, 98.3 and 93.4, which average 95.6.
Data: daily GC=F candles from Yahoo Finance, retrieved on 7 November 2026, with the 14, 3 stochastic calculated from the raw formula. This is past data for a COMEX futures contract, not spot XAUUSD at a broker, and not a trade recommendation.
One caution when comparing with your own screen. The orange line on this chart is the %K of the slow 14-3-3 version, so if you set 14, 3, 3 on your platform, the two lines will sit one smoothing step away from the chart in this article. Every example below uses this fast 14, 3 version.
Stochastic Overbought Oversold Levels: What 80 And 20 Really Mean
The stochastic overbought oversold zones follow two conventional levels. Above 80 is overbought, meaning the close sits near the top of the 14-candle range. Below 20 is oversold, meaning the close sits near the bottom.
The names are misleading, because they describe the position of price inside a range rather than proof that price is expensive or cheap. According to StockCharts, overbought is not necessarily a sell signal and oversold is not necessarily a buy signal, and in a strong trend the indicator can stay at an extreme for a long time. Measurements on gold show this clearly. Across 490 daily candles from late 2024 to 6 November 2026, %K was above 80 on 149 candles, about 30% of the time. The longest run was 16 sessions in a row, ending on 25 August 2026.
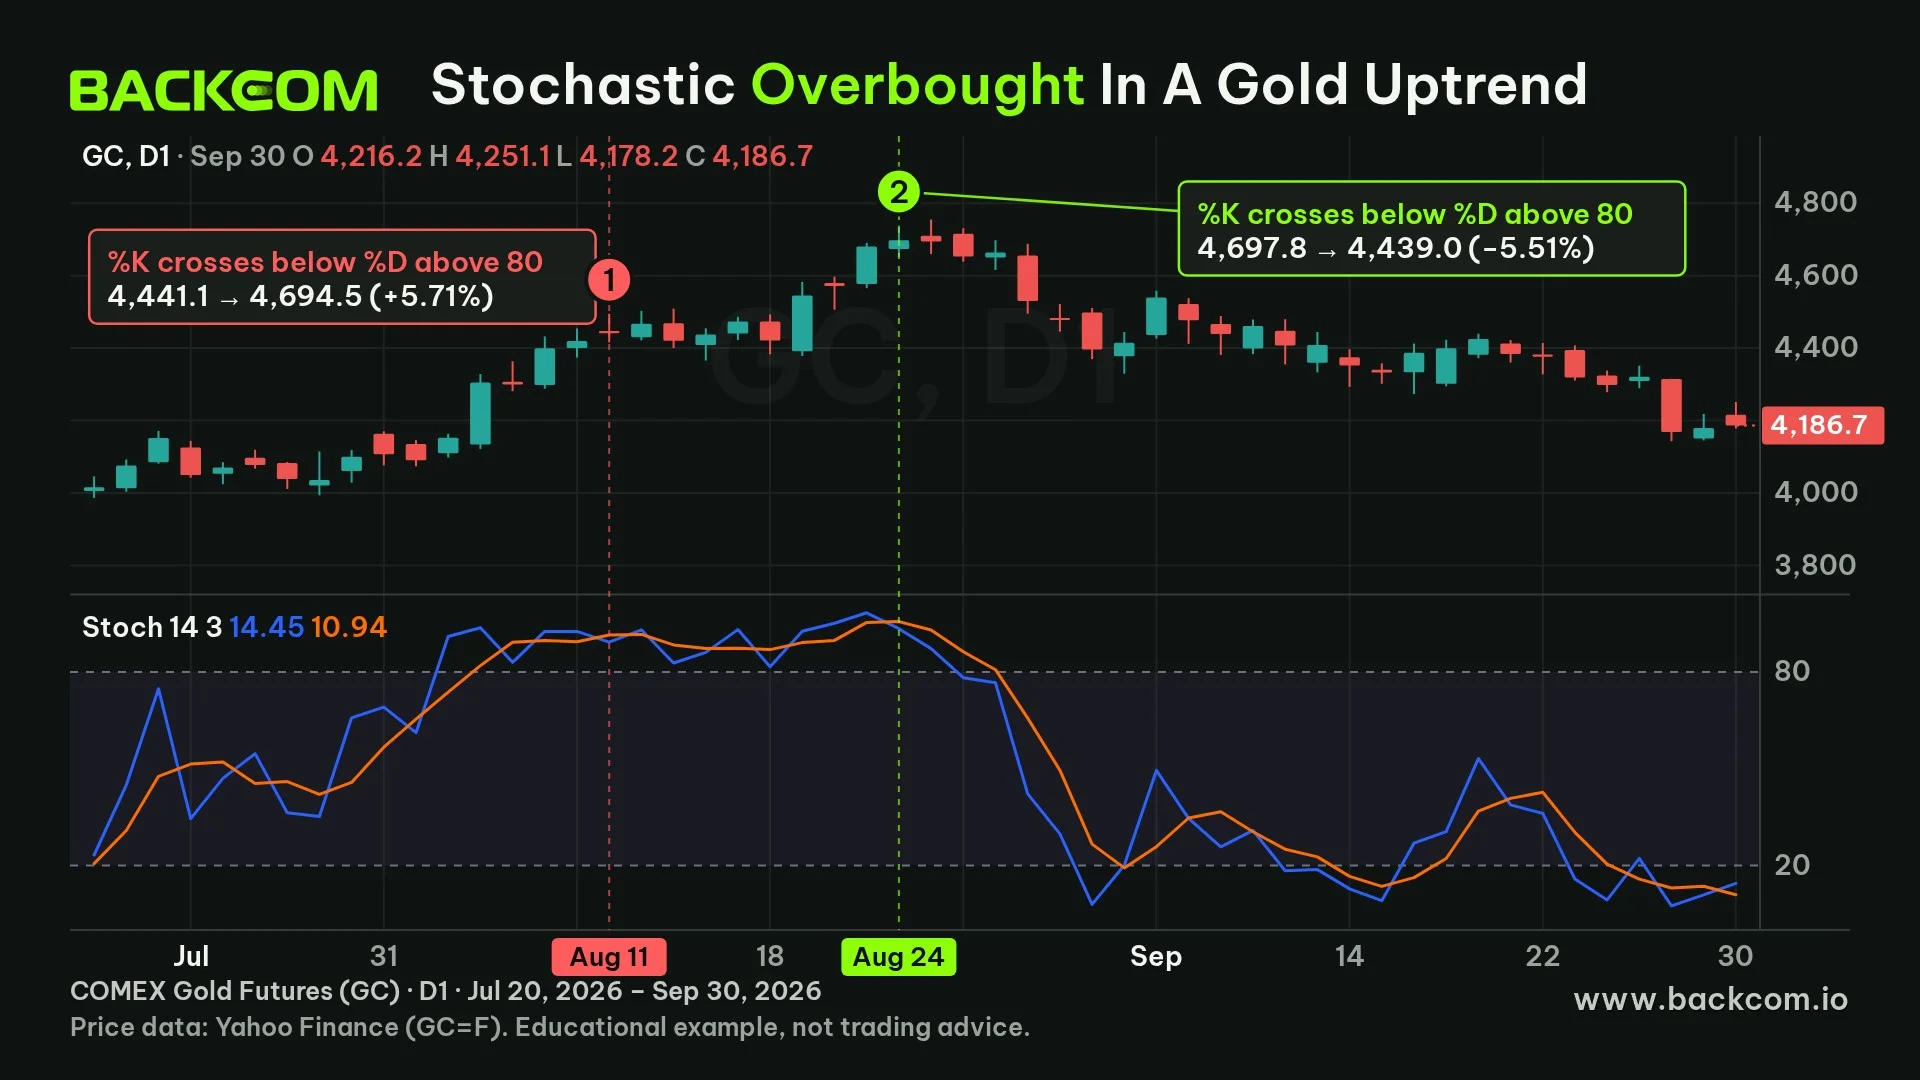
The chart at the top of this section covers that period. From 20 July to 30 September 2026, %K crossed below %D from above 80 five times, on 6, 11, 13, 18 and 24 August. After the first three, price still rose another 5.5 to 6.3% over 10 sessions, after 18 August it fell only 0.55%, and only after 24 August did it fall clearly. The chart marks two representative cases with opposite results:
- First, 11 August 2026: the close was 4,441.1. Ten sessions later price was 4,694.5, up 5.71%, so the sell signal was completely wrong.
- Second, 24 August 2026: the close was 4,697.8. Ten sessions later price was 4,439.0, down 5.51%, so the sell signal was right.
The two signals look identical on the indicator and differ only in context. The first came while the rally was still accelerating. The second came after the move had already run more than 700 USD from the low of 3,993.8 on 29 July 2026. Traders should therefore ask where price is in the trend before asking which zone the indicator is in.
Data: daily GC=F candles from Yahoo Finance, retrieved on 7 November 2026. Results are measured by the close 10 sessions later, are past examples only, and are not a recommendation.
How To Use The Stochastic Oscillator With %K And %D Crossovers
A common way to use the stochastic oscillator is to wait for %K to cross %D. A cross up suggests rising momentum is returning, and a cross down suggests falling momentum is returning. A more careful reading is to wait for the indicator to turn back inside the 80 or 20 zone instead of acting the moment it touches it. That avoids selling as soon as the indicator pushes above 80 while price is still rising.
Traders usually boil this down to four reading rules:
- Cross up from below 20: suggests rising momentum is returning after a decline.
- Cross down from above 80: suggests falling momentum is returning after a rally.
- Cross of the 50 line: %K moving above 50 shows the close has moved into the upper half of the range, which StockCharts uses to confirm divergence.
- Take only signals that follow the larger trend: StockCharts advises ignoring extreme signals that go against the trend.
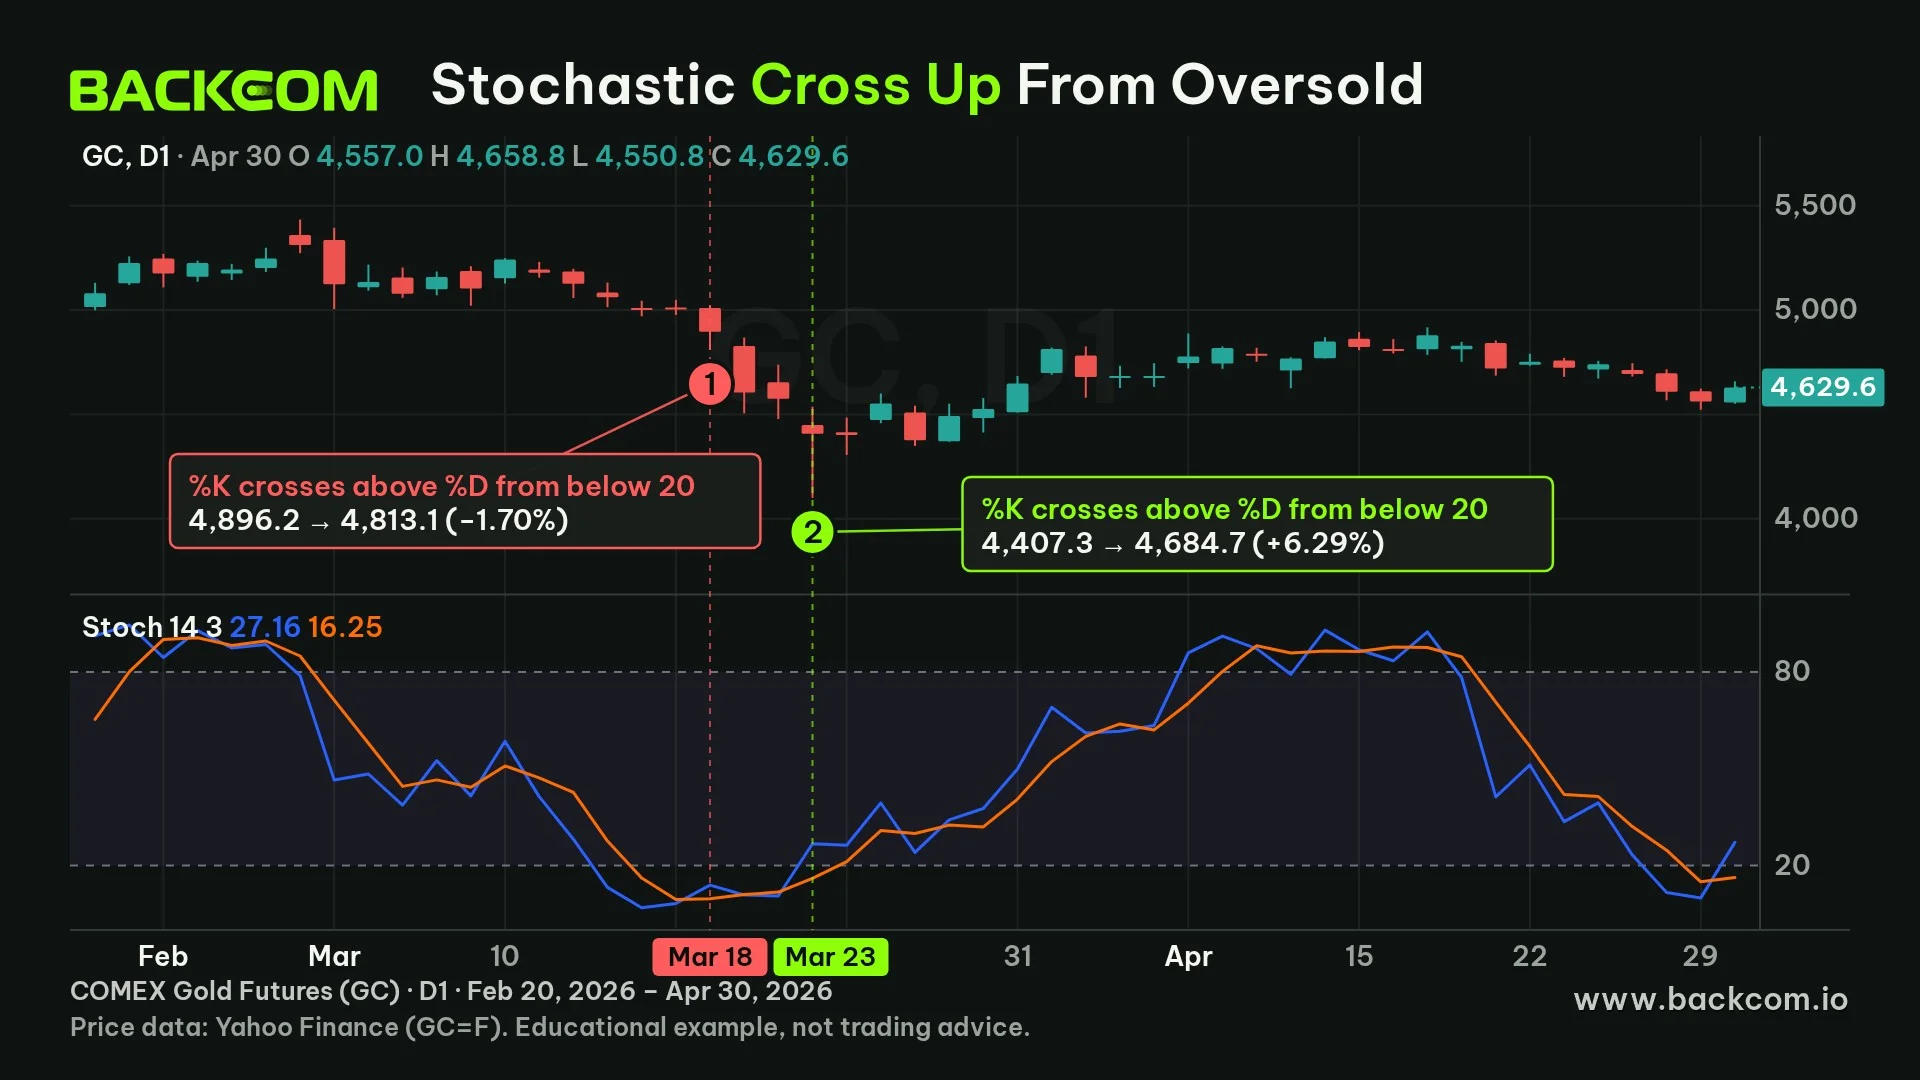
The chart at the top of this section shows two times %K crossed above %D from below 20 on gold, only 3 trading sessions apart:
- First, 18 March 2026: the close was 4,896.2. Ten sessions later price was 4,813.1, down 1.70%.
- Second, 23 March 2026: the close was 4,407.3. Ten sessions later price was 4,684.7, up 6.29%.
Between the two signals, gold fell a further 10% or so. Anyone who bought on the first signal sat through that drop before the second signal appeared.
To see whether this is chance or a pattern, count the whole sample. On daily GC candles from 7 November 2024 to 6 November 2026, with the rule that %K crosses %D after %K was in an extreme zone within the two previous candles, the results after 10 sessions were:
| Signal | Signals with a full 10 sessions | Price moved the expected way | Rate |
|---|---|---|---|
| Cross down from above 80 (sell) | 47 | 16 | 34% |
| Cross up from below 20 (buy) | 34 | 18 | 53% |
Data: daily GC=F candles from Yahoo Finance, retrieved on 7 November 2026, measured by the close after 10 sessions, with no trading costs or stop loss included. This is past statistics for one instrument, not a recommendation.
The result fits the StockCharts warning. While gold moved from around 2,700 USD to a high of 5,586.2 on 29 January 2026, sell signals from the overbought zone were right only about a third of the time. Buy signals from the oversold zone were right close to half the time, which is not enough to call an edge. Traders should not conclude that buying oversold always beats selling overbought, because the rate depends on the trend of the period measured.
Stochastic Divergence: An Early Signal That Often Fails
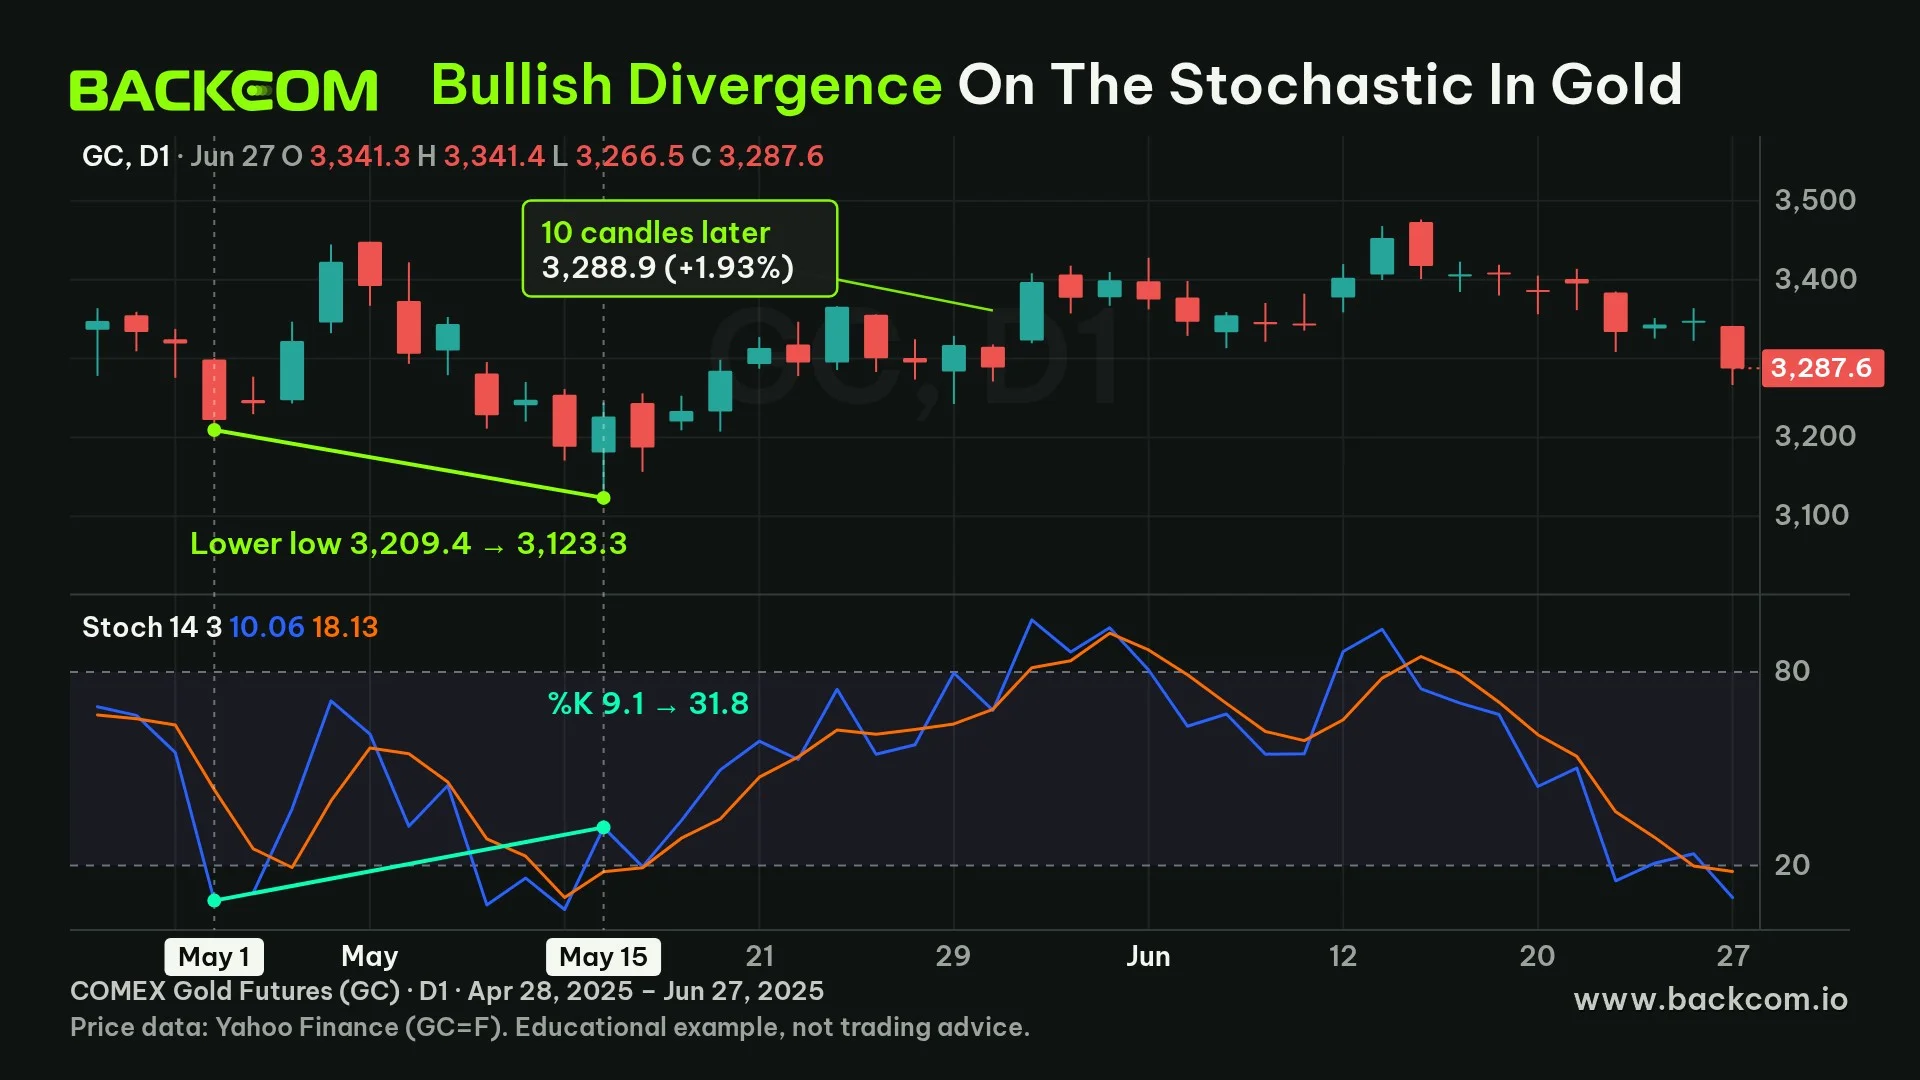
Stochastic divergence happens when price and the indicator tell different stories. According to StockCharts, bullish divergence is price making a lower low while the indicator makes a higher low, and bearish divergence is price making a higher high while the indicator makes a lower high.
There are two basic forms:
- Bullish divergence: downward momentum is fading even though price still makes a new low, so a rebound may follow.
- Bearish divergence: upward momentum is fading even though price still makes a new high, so a pullback may follow.
The chart at the top of this section shows a clear bullish divergence on gold. Price made a low on 1 May 2025 at 3,209.4, then a lower low on 15 May 2025 at 3,123.3. Over the same stretch %K rose from 9.1 to 31.8. Ten sessions later the close was 3,288.9, which is 1.93% above the close of 3,226.6 on the low candle.
Not every signal looks that good. Using a simple rule, where swing highs and lows are found with 5 candles on each side and two swings are at most 40 candles apart, gold produced 8 clear divergences in two years. After 10 sessions, price moved the expected way in 5 of them and the opposite way in 3. One of the failures was the bullish divergence of 28 May 2026 (%K from 5.7 to 32.3), after which price still fell another 8.56%.
Keep one limit of this measurement in mind. A swing is only confirmed after 5 candles, while the 10-session check starts from the swing candle itself. In live trading you only know about that low 5 sessions later, so real results are usually worse than the table suggests. A careful process has these steps:
- Pick two clear highs or two clear lows on the same timeframe, and do not connect small wiggles.
- Compare the highs and lows of price with those of %K at exactly those two moments.
- Wait for confirmation, such as %K crossing %D, moving above 50, or price breaking a nearby support or resistance level.
- Set an invalidation point beyond the last low or high of price.
Data: daily GC=F candles from Yahoo Finance, retrieved on 7 November 2026. The divergences were found automatically by the 5-candle swing rule, not picked by hand, and are past examples only, not a recommendation.
Stochastic Oscillator Settings On MT5: Step By Step
Setting up the stochastic oscillator on MetaTrader 5 has two parts: adding the indicator to the chart, then deciding which filter you use to read it. The second part matters far more than the first.
To add the indicator:
- Open the chart of the pair or gold you want to follow in MT5.
- Go to the Insert menu, choose Indicators, then Oscillators, and select Stochastic Oscillator.
- Enter %K period 14, %D period 3 and Slowing 3 for the 14-3-3 setting, or set Slowing to 1 for the fast version used in the charts here.
- Keep the Simple method for %D, confirm, and the indicator appears in a sub-window under the price chart.
Note: according to the official MetaTrader 5 help page, Slowing of 1 gives the fast stochastic and 3 gives the slow stochastic, and the 80 and 20 levels are only examples rather than required values. The page does not state default values, so check the settings dialog to see what your platform uses. If you are unsure how the two platforms differ, see the guide to MT4 vs MT5 differences.
After adding the indicator, choose a clear reading rule before you trade:
- Take only signals that follow the larger trend: for example, if price is above a long moving average, look only at buy signals from below 20.
- Skip counter-trend signals while %K hugs an extreme: this is when the indicator tends to stick the longest.
- Combine it with price zones: a signal at support or resistance is more reliable than one in open space.
- Test on a demo account and past data: default settings do not guarantee results on every instrument.
Limits Of The Stochastic And 4 Common Mistakes
The stochastic has three main limits according to the sources checked: it can sit at an extreme for a long time in a strong trend, it gives many crossovers when price moves sideways, and its results change with the period you choose. StockCharts notes that shorter periods make the indicator sensitive and noisy, while longer periods make it smoother with fewer signals.
Four mistakes traders often make with the stochastic:
- Selling as soon as the indicator passes 80: on gold, %K stayed above 80 for 16 sessions in a row while price kept rising.
- Buying as soon as the indicator drops below 20 in the middle of a sharp decline: the 18 March 2026 chart shows price falling another 10% or so after the first signal.
- Treating every crossover as a trade: when price moves sideways, %K and %D cross constantly, and trading costs add up across a string of small trades.
- Using it alone without risk management: the indicator says nothing about where to place a stop loss or how large the position should be.
A common solution is to use the stochastic for timing, and base the reason to enter on trend, price zones and risk. Calculate position size with the position size calculator and set the exit by following the guide to setting a stop loss before you click.
Stochastic Signals And Trading Costs
Stochastic signals on small timeframes appear often, so trading costs are something traders should not ignore. Every order pays the spread, and many accounts also charge commission.
A crossover-based approach can produce dozens of trades a week, so even a small spread difference adds up. Part of that cost can be offset by a rebate calculated on closed lots, but a rebate does not turn a bad trade into a good one and does not cover a losing trade.
Backcom.io is an independent introducing broker (IB/affiliate) of the brokers listed, and rebates are paid from the commission the broker pays Backcom.io, as set out in the risk disclaimer. You can review current conditions and rebate levels on the list of partner brokers.
Frequently Asked Questions (FAQ) About The Stochastic Oscillator
Is A Stochastic Reading Below 20 A Buy Signal?
Not necessarily. A stochastic reading below 20 only says the close sits near the bottom of the 14-candle range, and StockCharts states that oversold is not necessarily a buy signal. On gold, buy signals from below 20 were right 18 times out of 34 after 10 sessions. Wait for confirmation and check the larger trend before entering.
Should I Use The Stochastic Or RSI?
The two indicators answer different questions. The stochastic measures where the close sits in the high-low range, while RSI measures the strength of recent up and down moves. You can test both on past data of the same instrument, but using them together for the same signal often just repeats information.
What Are The Best Stochastic Settings?
There is no best setting for every market. 14, 3, 3 is a commonly used setting according to StockCharts, alongside 20, 5, 5, and shorter periods give noisier signals. Test one rule across several timeframes on past data, then choose the setting that fits how often you can watch the chart.
Is Stochastic Divergence Reliable?
Not always. Stochastic divergence signals earlier than a crossover, but on gold only 5 of 8 cases moved the expected way after 10 sessions. Price can diverge several times and still continue its trend. Treat divergence as a warning that needs confirmation from price structure.
Conclusion: The Stochastic Oscillator And How To Use It To Read Price Position
Understanding the stochastic oscillator comes down to three points: %K shows where the close sits in the 14-candle range, %D smooths %K to form a signal line, and the 80 and 20 levels describe position rather than give orders. Traders need to look at the larger trend, price zones and risk management together instead of waiting for the indicator to touch a level.
If you are new to the market itself, start with what forex trading is and how it works. A practical next step is to add the 14, 3, 3 stochastic to a demo chart, log every crossover and divergence for a few weeks, and compare them with what price actually did. Once you have a clear rule, you can read on about Ichimoku Cloud or how to draw trendlines for extra trend filters, or browse more guides in the forex knowledge category.
Disclaimer: This content is compiled by Backcom.io for information only and is not investment advice or a trade recommendation. Trading forex and CFDs involves leverage and high risk, and you can lose all of your capital. The examples in this article are past data for a gold futures contract, technical indicators do not guarantee results, and you need to test them yourself before placing any order.
Was this article helpful?
Join The Backcom.io Community
Get the latest on trading rebates, trading tips, and broker deals — and connect with thousands of traders worldwide.

Backcom App
Track Your Rebates Every Day
Every rebate is visible by broker and by day. Manage your wallet and withdrawals in one place.
Open Backcom App