RSI Divergence Explained: Regular Vs Hidden Divergence In Forex

Many traders see price print a new high while RSI refuses to follow, then rush to sell into a rally that has not finished. The question of what RSI divergence really means sounds simple, but unless you can tell regular divergence from hidden divergence, it is easy to read a trend-continuation signal as a reversal signal.
In this article, Backcom.io walks through what traders look up most about this technique, with measurements on real gold prices:
- What RSI divergence is and how the 14-period RSI is calculated.
- How regular and hidden divergence differ, summed up in one table.
- How to draw RSI divergence step by step, including on MT5.
- Four examples with dates, prices and outcomes, then an honest answer on how reliable divergence is.
What Is RSI Divergence? When Price And The Indicator Tell Different Stories
RSI divergence is a situation where the highs or lows of price and the highs or lows of the RSI indicator move in different directions. It shows that the strength of the current push is changing even though price has not turned yet. The key point is that divergence does not say price will reverse. It only says the momentum behind the current move is fading or building.
RSI is a momentum indicator developed by J. Welles Wilder and plotted on a scale from 0 to 100. According to StockCharts ChartSchool, the formula fits on one line:
RSI = 100 − 100 ÷ (1 + RS), where RS = Average gain ÷ Average loss over 14 periods
Wilder treated RSI above 70 as overbought and below 30 as oversold. The official MetaTrader 5 help page also notes that 14 periods is the length Wilder recommended, with 9 and 25 periods also popular.
A worked number helps. The daily gold futures candle of 11 June 2026 closed at 4,114.0 USD and its 14-period RSI was 25.2, deep below the 30 line. RSI uses closing prices only, so that reading does not depend on the day's low of 4,046.2.
Because RSI measures how fast recent closes rose or fell, price can keep going for another stretch while the indicator fails to set a new high or low. The two lines then point in opposite directions, and that is divergence.
Regular and hidden divergence differ in how price and RSI are compared. Regular divergence suggests the current push is weakening, so it is usually read as a reversal warning. Hidden divergence suggests the trend is only resting, so it is usually read as a continuation hint.
| Type | Price | RSI | Common reading |
|---|---|---|---|
| Regular bullish | Lower low | Higher low | Selling pressure fading, a bounce may follow |
| Regular bearish | Higher high | Lower high | Buying pressure fading, a pullback may follow |
| Hidden bullish | Higher low | Lower low | Uptrend may continue |
| Hidden bearish | Lower high | Higher high | Downtrend may continue |
Definitions referenced from StockCharts as at 15 November 2026. The term "hidden divergence" is not used consistently across sources, so check terminology before comparing with other material.
StockCharts describes the regular types as bullish and bearish divergence. It cites Cardwell's names, positive reversal and negative reversal, for the other two: RSI makes a lower low while price makes a higher low, or the mirror image at highs. Most traders call this hidden divergence.
Why does hidden divergence fit trend continuation? According to Constance Brown, quoted by StockCharts, RSI in an uptrend tends to range between 40 and 90 with the 40 to 50 zone acting as support. In a downtrend it ranges between 10 and 60 with 50 to 60 acting as resistance. A pullback that drags RSI to a lower low near 40 to 50 while price holds a higher low is the picture of hidden bullish divergence.
A quick memory aid:
- Regular divergence: looks for a turning point, usually at the end of a long push.
- Hidden divergence: looks for a continuation point, usually after a pullback inside an existing trend.
So before naming the pattern, traders should decide whether the trend is up or down. The same higher low in price can be hidden divergence in an uptrend, or just a bounce inside a downtrend.
How To Draw RSI Divergence Step By Step
How to draw RSI divergence comes down to five steps on a single timeframe, linking only clear swing highs and lows. Connecting every small wiggle is the mistake that makes every chart show divergence.
- Add RSI 14 to the chart. In MT5, open Insert, choose Indicators, then Oscillators and select Relative Strength Index with a period of 14.
- Find two clear price highs or two clear lows. The rule used for every example here is a candle whose high or low is the extreme of the 5 candles on each side, with the two points at most 60 candles apart.
- Read RSI at exactly those two candles. Do not take an RSI peak a few candles away, because then the two points no longer share a moment.
- Draw a line between the two price points, then between the matching RSI points. Lines sloping in opposite directions mean divergence, and the table above tells you whether it is regular or hidden.
- Wait for confirmation before acting. A swing is only confirmed after a few more candles, so traders need an extra condition such as a break of the nearest price zone or RSI crossing 50.
The RSI numbers in this article follow Wilder's formula, so compare them with the indicator values on the platform you use. For price zones as a confirmation filter, the guide on how to draw trendlines shows how to connect the trend.
Regular Bearish Divergence On Gold: A Correct Call In April 2025
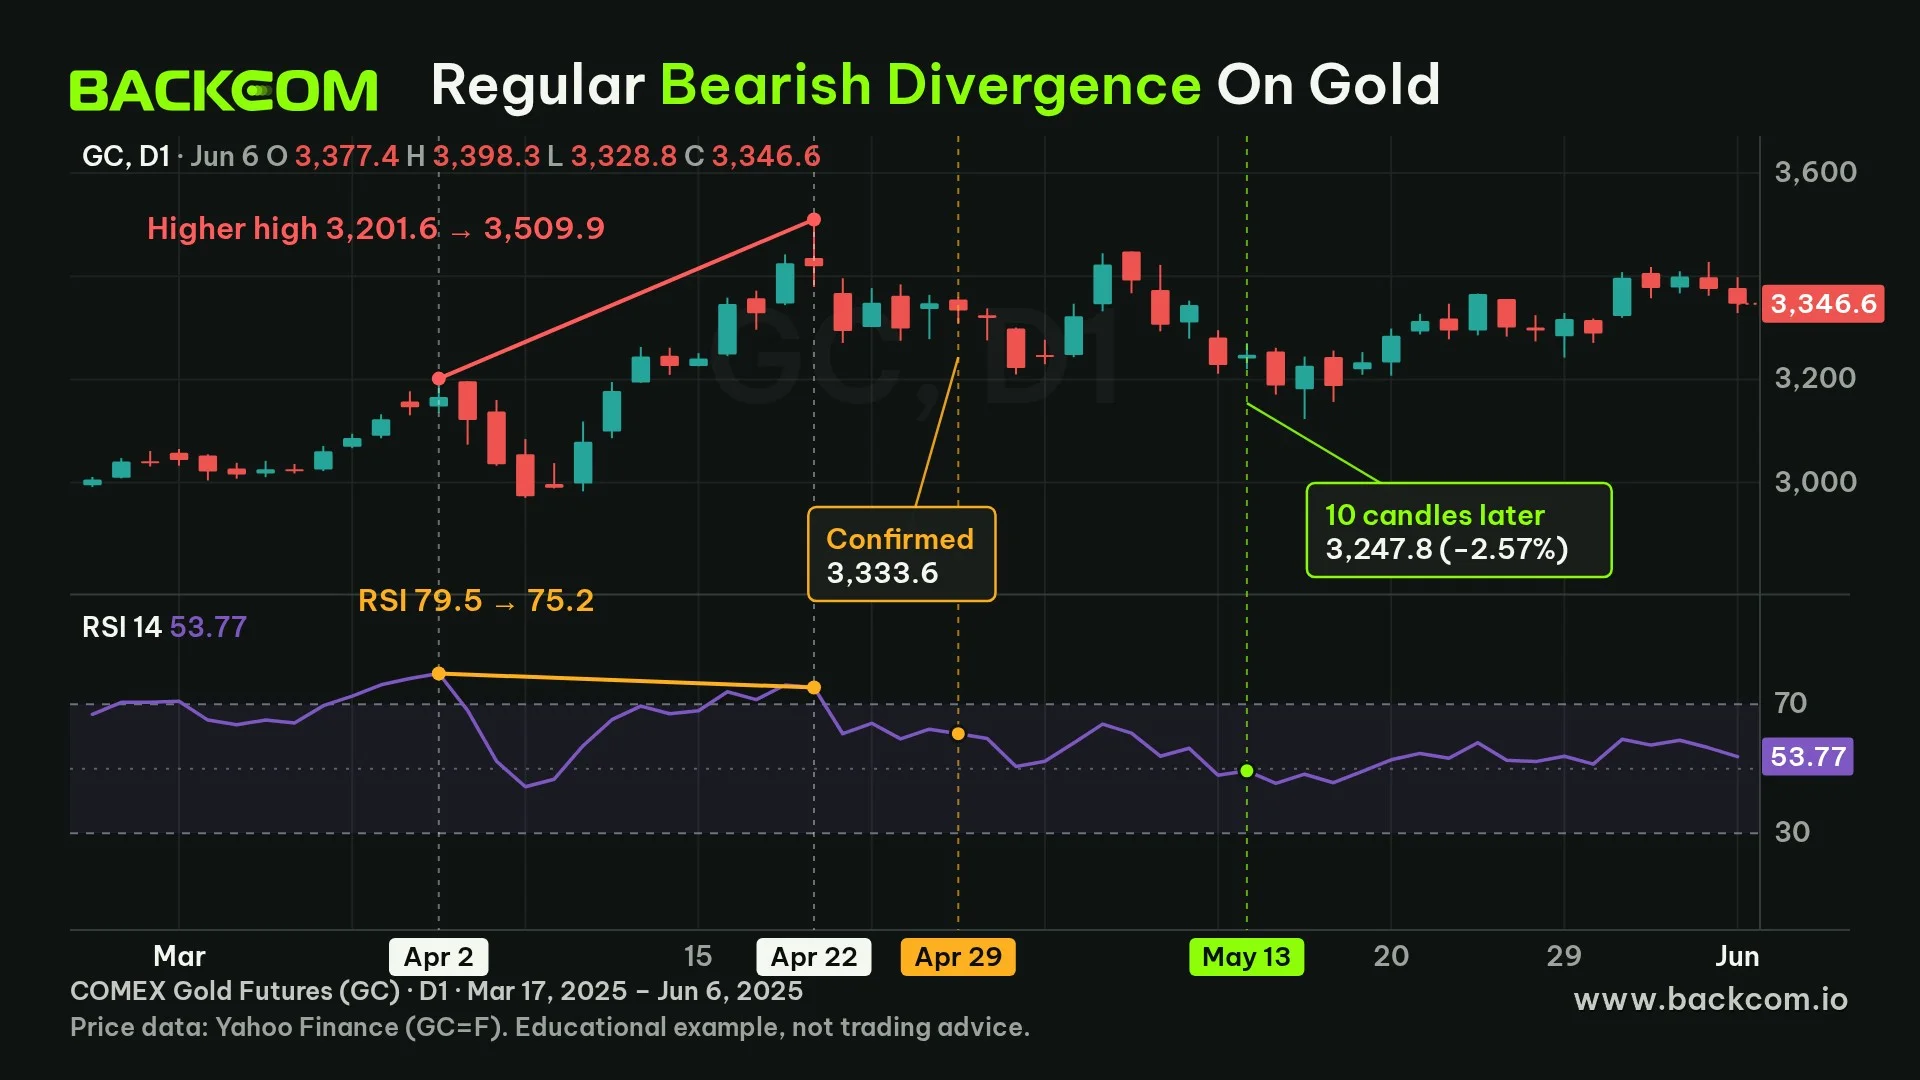
The first example is regular bearish divergence on daily COMEX gold futures (GC) candles. Price made a high on 2 April 2025 at 3,201.6 USD with RSI at 79.5, then a higher high on 22 April 2025 at 3,509.9 USD with RSI down to 75.2.
Price was 308.3 USD higher while RSI was 4.3 points lower, so this is regular bearish divergence. With the 5-candle rule, the 22 April high is only confirmed on the 29 April 2025 candle, which closed at 3,333.6 USD with RSI already down to 60.9.
Measured from the confirmation candle, the outcome was:
- After 10 candles, on 13 May 2025: price closed at 3,247.8 USD, down 2.57%, in the direction the divergence suggested.
- Along the way: price touched 3,448.2 USD on 7 May 2025, 3.4% above the confirmation close, so a trader who sold early had to sit through a counter-move before the drop.
Keep one example in perspective. On the same data, the earlier regular bearish divergence of 24 February 2025 went the other way, with price rising another 3.62% over 10 candles. Two bearish signals, one right and one wrong.
Data: daily GC=F candles from Yahoo Finance, retrieved on 15 November 2026, RSI 14 calculated with Wilder's formula. This is past price data of a COMEX futures contract, not a trade recommendation.
RSI Divergence XAUUSD: Does Futures Data Match Your Broker's Chart?
Many traders search for RSI divergence XAUUSD because they trade spot gold at a broker. The data here is COMEX futures, so a broker's XAUUSD price differs slightly from GC, and swing points or RSI values can shift with it. Open your own broker's XAUUSD chart, redraw the two points with the five steps above, and read the numbers on that screen.
A Bullish RSI Divergence Is Not Always Right: Two Cases From 2026
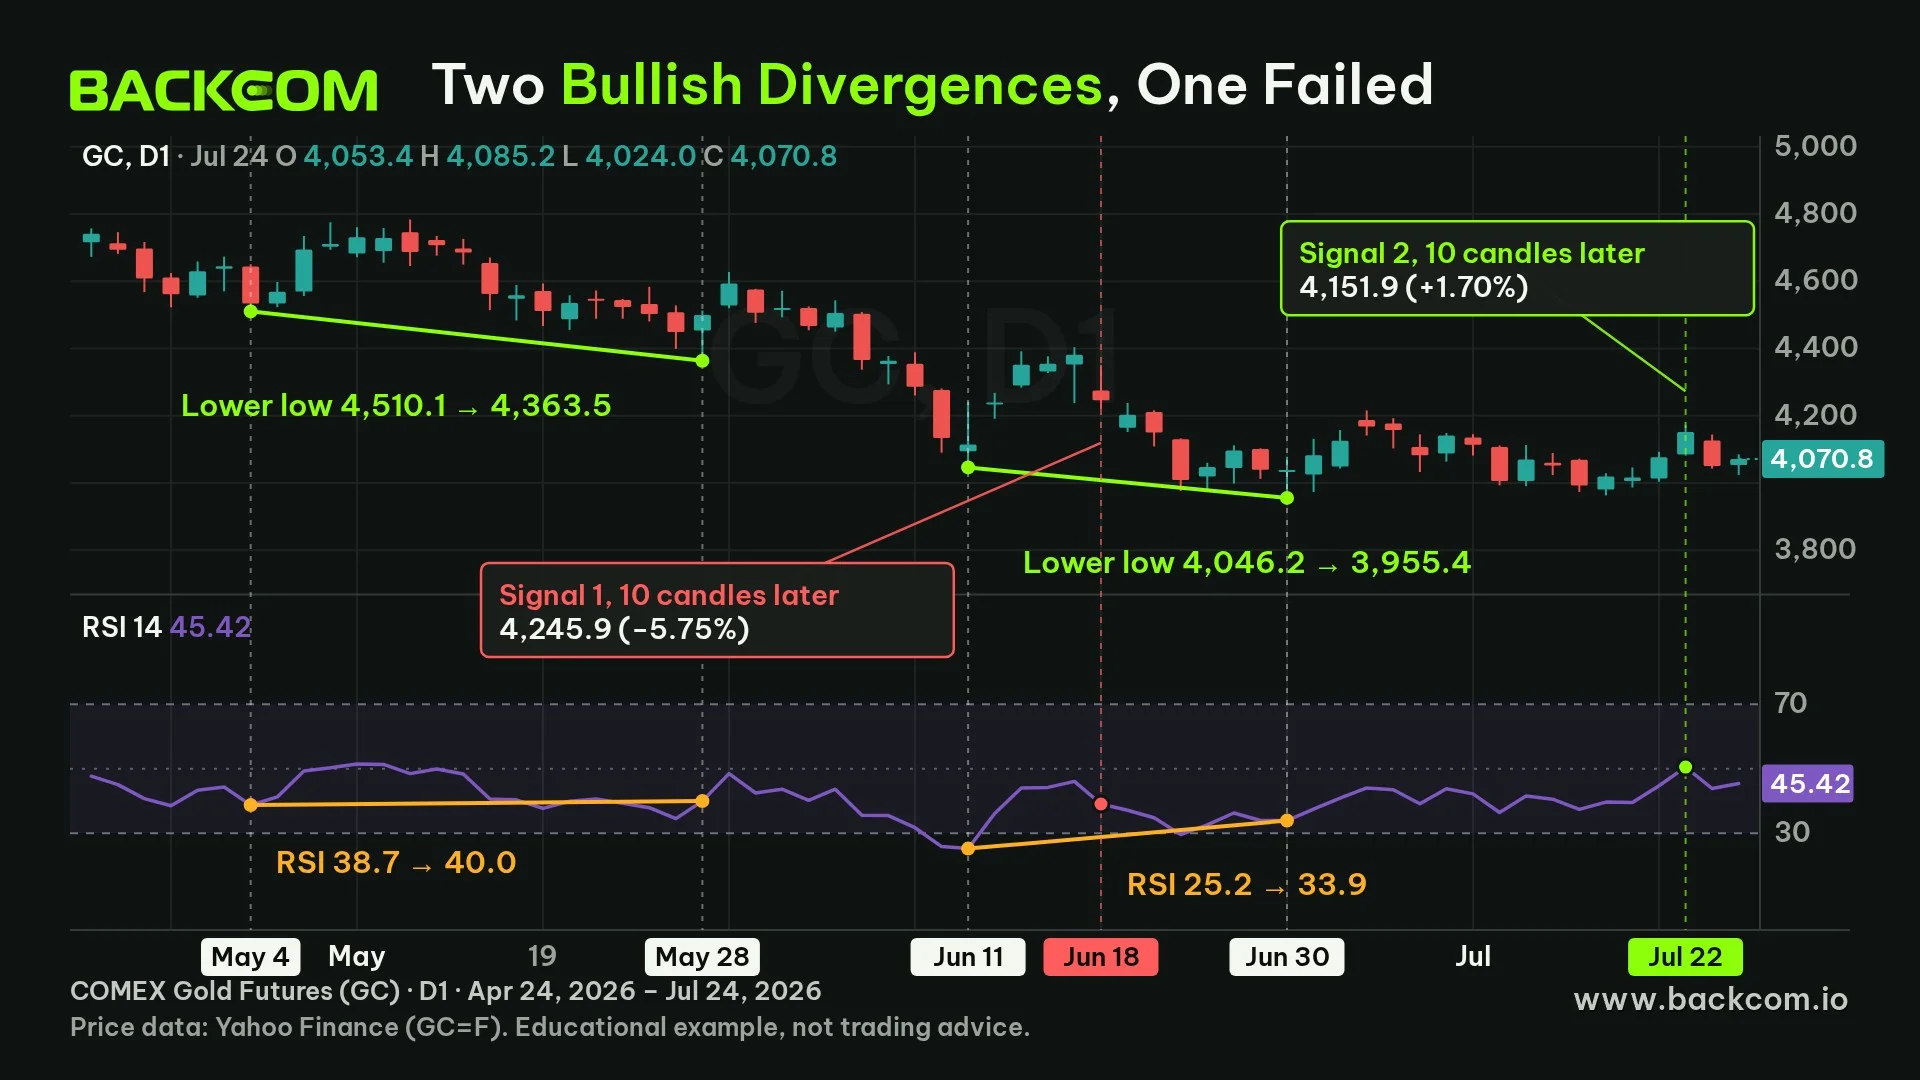
Two consecutive bullish RSI divergence signals on gold in 2026 show the same shape producing opposite results. The first had a price low on 4 May 2026 at 4,510.1 USD with RSI at 38.7, then a lower low on 28 May 2026 at 4,363.5 USD with RSI at 40.0.
The first case was faint, with RSI only 1.3 points higher. The confirmation candle on 4 June 2026 closed at 4,505.0 USD. Ten candles later, on 18 June 2026, price was 4,245.9 USD, down 5.75%, and at one point sat 10.2% below the confirmation close when it hit 4,046.2 USD on 11 June 2026.
The second case was much clearer. The low on 11 June 2026 was 4,046.2 USD with RSI at 25.2, then a lower low on 30 June 2026 at 3,955.4 USD with RSI at 33.9, which is 8.7 points higher. The confirmation candle on 8 July 2026 closed at 4,082.4 USD, and 10 candles later price was 4,151.9 USD, up 1.70%.
Two lessons from this pair:
- The size of the RSI gap matters: the case with RSI up only 1.3 points failed and the case with RSI up 8.7 points from below 30 worked, though two cases are far too few to conclude anything.
- The first divergence is not the end of a decline: the first case sat inside a long drop from 4,510 to below 4,050 USD, and only the final low produced the correct signal.
Data: daily GC=F candles from Yahoo Finance, retrieved on 15 November 2026, measured from the confirmation candle's close. Past examples only, not a recommendation.
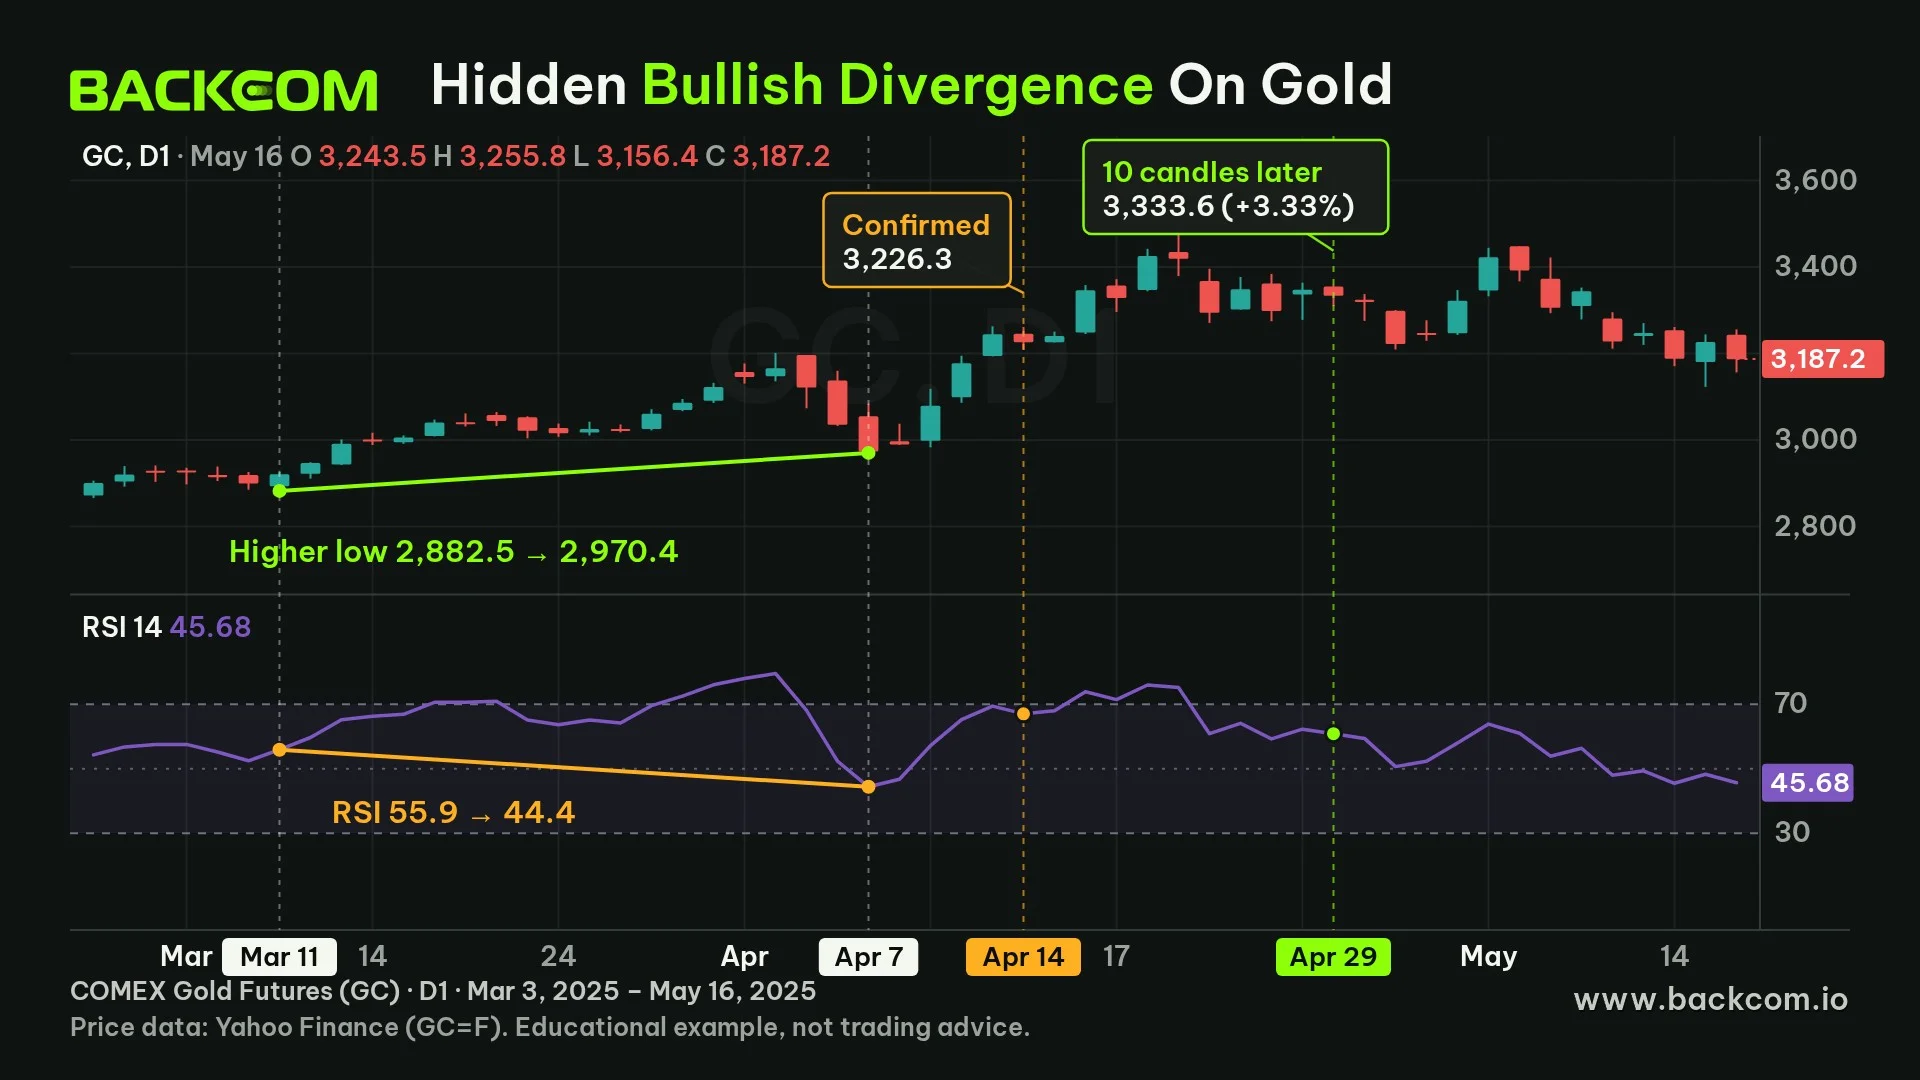
Hidden divergence on the bullish side appears when price holds a higher low while RSI makes a lower low. On daily gold, price made a low on 11 March 2025 at 2,882.5 USD with RSI at 55.9, then a higher low on 7 April 2025 at 2,970.4 USD with RSI down to 44.4.
Price was 87.9 USD higher while RSI was 11.5 points lower. A reading of 44.4 sits right in the 40 to 50 zone that Constance Brown describes as RSI support in an uptrend. The confirmation candle on 14 April 2025 closed at 3,226.3 USD.
Ten candles later, on 29 April 2025, price closed at 3,333.6 USD, up 3.33%. Over those 10 candles the lowest price was only 0.02% below the confirmation close, so a buyer barely sat through any counter-move.
It is a tidy case, and it is worth saying why. Over the two years measured, gold went from about 2,600 USD to above 5,000 USD, and this case sat inside that uptrend, so a continuation signal had the big flow behind it. Hidden divergence works while the trend is alive and has no way to test that trend on its own.
Data: daily GC=F candles from Yahoo Finance, retrieved on 15 November 2026, measured from the confirmation candle's close. Past examples only, not a recommendation.
How Reliable Is RSI Divergence? Two Years Of Gold Data
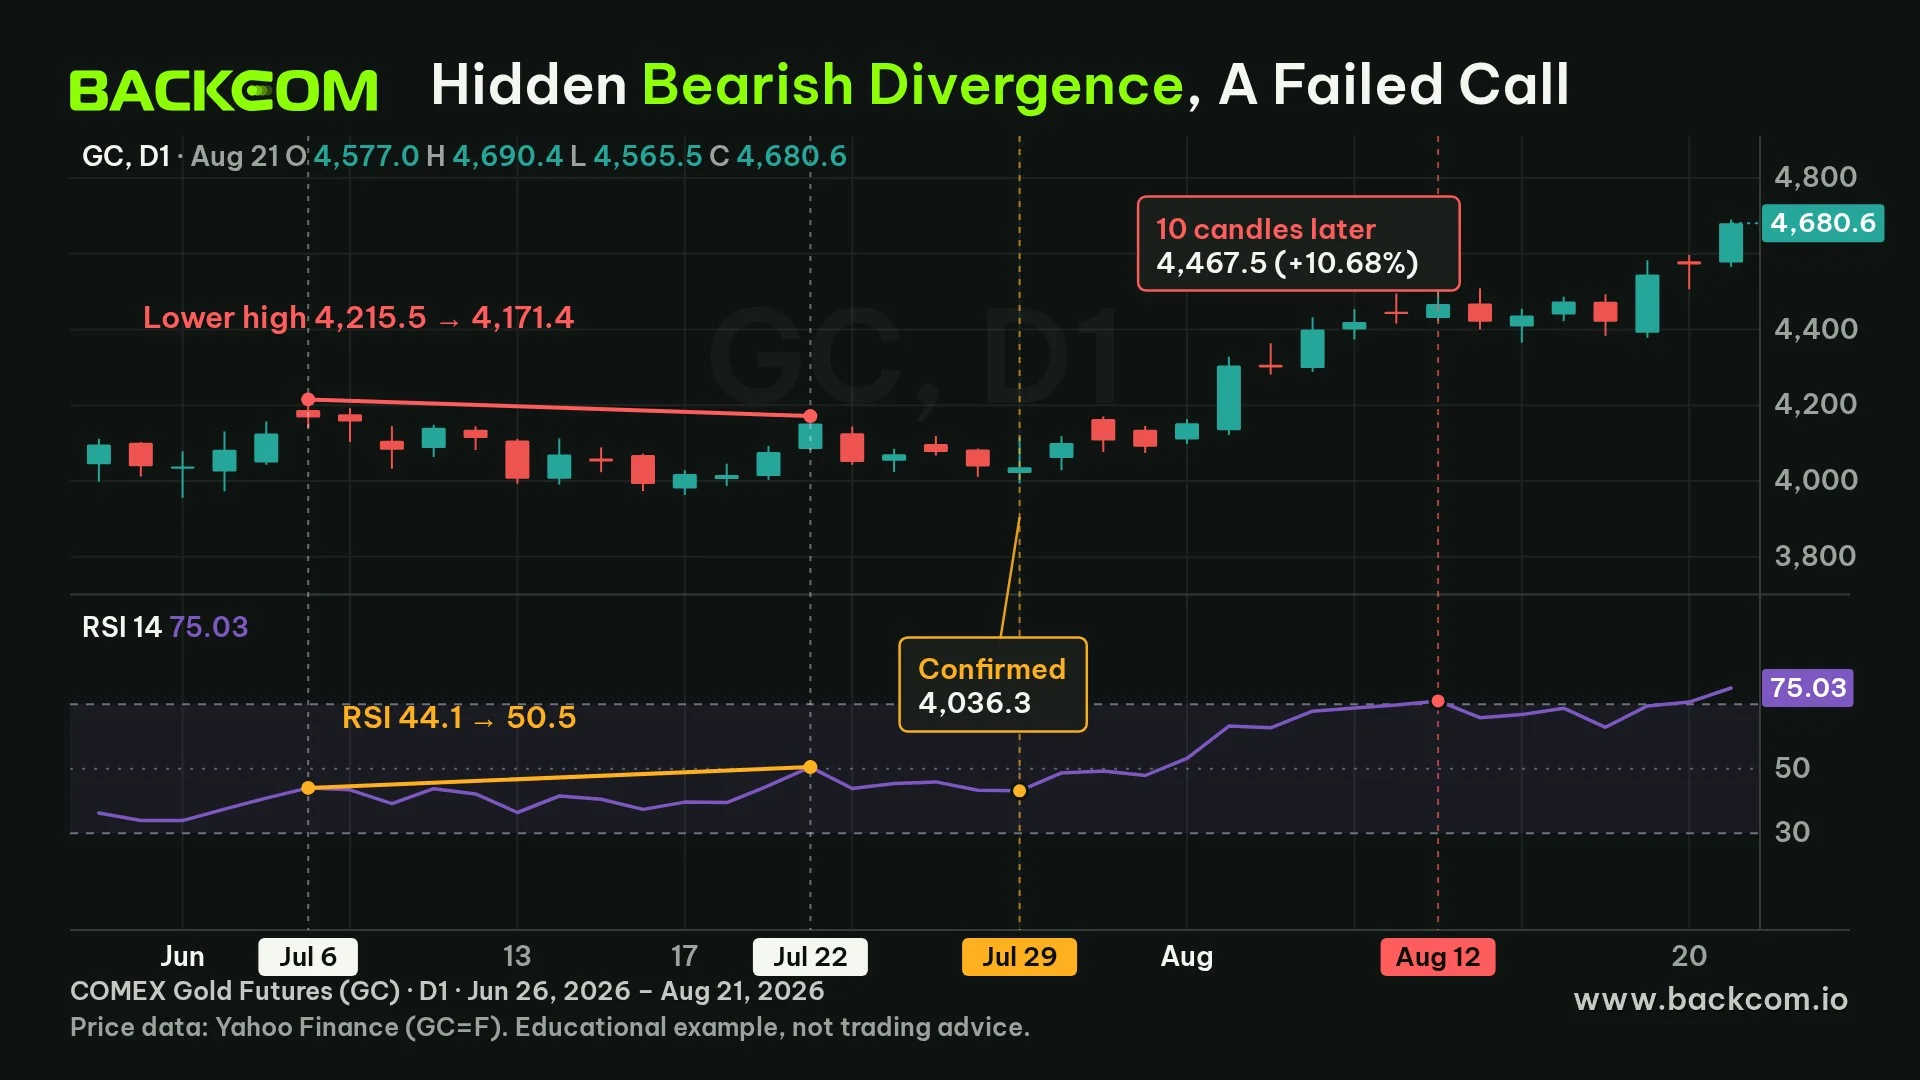
To judge whether RSI divergence can be trusted, traders need to look at the failures too. The last example is a hidden bearish divergence while price sat below its long moving averages. The high on 6 July 2026 was 4,215.5 USD with RSI at 44.1, then a lower high on 22 July 2026 at 4,171.4 USD with RSI at 50.5.
The shape is textbook. The confirmation candle on 29 July 2026 closed at 4,036.3 USD and hidden bearish divergence hints at a continued decline. Ten candles later, on 12 August 2026, price closed at 4,467.5 USD, up 10.68%. A short trade on this signal would have lost heavily, and nothing in the divergence shape could warn of it.
To see whether this is an exception or the rule, the table counts every case the same swing rule found on daily gold candles from 15 November 2024 to 13 November 2026:
| Type | Cases with 10 candles of follow-up | Price moved the expected way | Rate |
|---|---|---|---|
| Regular bearish | 2 | 1 | 50% |
| Regular bullish | 3 | 1 | 33% |
| Hidden bullish | 4 | 4 | 100% |
| Hidden bearish | 1 | 0 | 0% |
Data: daily GC=F candles from Yahoo Finance, retrieved on 15 November 2026, RSI 14 with Wilder's formula, measured from the confirmation candle's close to 10 candles later, before trading costs and stop losses. This is a past statistic on a single instrument, not a recommendation.
Read the numbers with care. Across 10 cases, price moved the expected way in 6. The sample is too small to give a rate, and all four winning hidden bullish cases fell in a strong gold uptrend, so you cannot conclude that hidden divergence beats regular divergence. What is safer is StockCharts' warning that divergences are misleading in a strong trend and that RSI should be used with other tools to filter false signals.
The measurement has a limit too. The 10-candle window starts at the confirmation candle, after the 5 candles of waiting, but it ignores slippage and the gap between futures and spot prices, so real results are usually worse than the table.
Combining RSI Divergence With Trend And Price Zones
RSI divergence works best as a warning that needs confirmation, not as an entry order. Traders usually pair it with three filters: the larger trend, price zones and risk management.
A cautious process looks like this:
- Decide the trend first. Regular bullish divergence inside a strong downtrend is only a hint of a bounce, and hidden divergence only means something once a trend exists to continue.
- Place the divergence on a price zone. A signal sitting right on notable support or resistance deserves more attention than one in empty space.
- Wait for a confirming candle. For example price breaking the nearest zone, or RSI crossing 50 in the signal's direction.
- Put the invalidation point beyond the last swing. The July 2026 hidden bearish case shows price can run more than 10% after a signal.
Four mistakes traders often make:
- Linking tiny swings: any chart will show divergence if you link enough wiggles, while the clear-swing rule used here found only 10 cases in two years.
- Treating the first divergence as the turning point: the 28 May 2026 bullish case is an example, with price falling another 10% after the signal.
- Selling regular bearish divergence while an uptrend accelerates: StockCharts warns that divergence misleads in a strong trend.
- Trading without a stop loss: divergence describes momentum and says nothing about where the trade is wrong.
For stop placement, see how to set a stop loss by invalidation point and ATR, and size the position with the position size calculator. Traders who use other momentum tools can compare with MACD divergence or Stochastic divergence, but using all three for the same signal usually repeats the same information.
RSI Divergence Signals And Trading Costs
Divergence signals appear frequently on small timeframes, so trading costs are not something traders should ignore. Every trade pays spread, and many accounts add a commission. A rebate based on lots closed can offset part of that cost, but it does not turn a wrong trade into a right one and cannot cover a losing trade.
Backcom.io is an independent introducing broker (IB/affiliate) of the brokers it lists. Rebates are paid from the commission the broker pays Backcom.io, as set out in the risk disclaimer. Traders can review current conditions and rebate levels on the partner broker list.
Frequently Asked Questions (FAQ) About RSI Divergence
Is RSI Divergence Reliable?
Not reliably. RSI divergence is a signal that needs confirmation, and on two years of daily gold only 6 of 10 cases moved the expected way after 10 candles. StockCharts states that divergences are misleading in a strong trend. Treat divergence as a warning that needs confirmation from price structure.
Neither wins in every situation. Regular divergence looks for turning points and hidden divergence looks for continuation points, so they serve two different plans. The sample here has only 10 cases, and hidden bullish divergence was right in all 4, but all 4 fell in a strong gold uptrend, which is not enough to rank the two.
What RSI Period Should I Use To Find Divergence?
The 14-period setting from Wilder is still the most common default, and the MT5 help page also mentions 9 and 25. Keep one period fixed while you track results, because changing it constantly shifts the RSI swing points and makes outcomes hard to compare.
Is One RSI Divergence Enough To Enter A Trade?
No. Divergence only shows that momentum and price disagree. It does not give an entry or a stop. The 22 July 2026 hidden bearish case had a textbook shape yet price rose 10.68% in 10 candles. Wait for confirmation, set an invalidation point and size the position before entering.
Conclusion: What RSI Divergence Is And How To Use It Carefully
Understanding RSI divergence means holding three ideas: regular divergence warns that the current push is weakening, hidden divergence hints that the trend may continue, and both are shapes rather than orders. Traders need to weigh the larger trend, price zones and risk management together instead of just waiting for two lines to point apart.
The next step is to add RSI 14 to a demo chart, draw divergences with the five steps above and record the result after 10 candles for a few weeks, then compare with the table in this article. Once you have a clear rule, browse more guides in the knowledge section.
Disclaimer: This content is compiled by Backcom.io for information only and is not investment advice or a trading recommendation. Trading forex and CFDs with leverage carries a high risk and you can lose all of your capital. The examples in this article are past data of a gold futures contract, technical indicators do not guarantee results, and traders should verify everything themselves before placing an order.
Was this article helpful?
Join The Backcom.io Community
Get the latest on trading rebates, trading tips, and broker deals — and connect with thousands of traders worldwide.

Backcom App
Track Your Rebates Every Day
Every rebate is visible by broker and by day. Manage your wallet and withdrawals in one place.
Open Backcom App